Investing
Haven
No Result
View All Result
Forecasting Global Markets
  • Login
  • 2023 Forecasts
  • Stocks
  • Commodities
  • Silver
  • Lithium
  • Crypto
  • Top AI Stocks →
  • Top Silver Stocks →
  • TOP ENERGY STOCKS →
  • Top Lithium Stocks →
  • CRYPTO SELECTION →
Investing
Haven
  • 2023 Forecasts
  • Stocks
  • Commodities
  • Silver
  • Lithium
  • Crypto
No Result
View All Result
InvestingHaven
No Result
View All Result

3 Long Term Stock Market Charts

by Taki Tsaklanos
March 25, 2017
in Trendwatching
0
Tags: DJIASPX
3 Long Term Stock Market Charts
Share on FacebookShare on Twitter

When analyzing long term stock market charts it is recommended to compare the charts on different timeframes. Moreover, it could be helpful to look at long term stock market charts on an inflation-adjusted base. This article features the S&P500 on 35 years and the 100 year inflation-adjusted chart.

We recently featured this long term stock market chart of the Dow Jones Industrials (DJI). However, in this article we take this one step further.

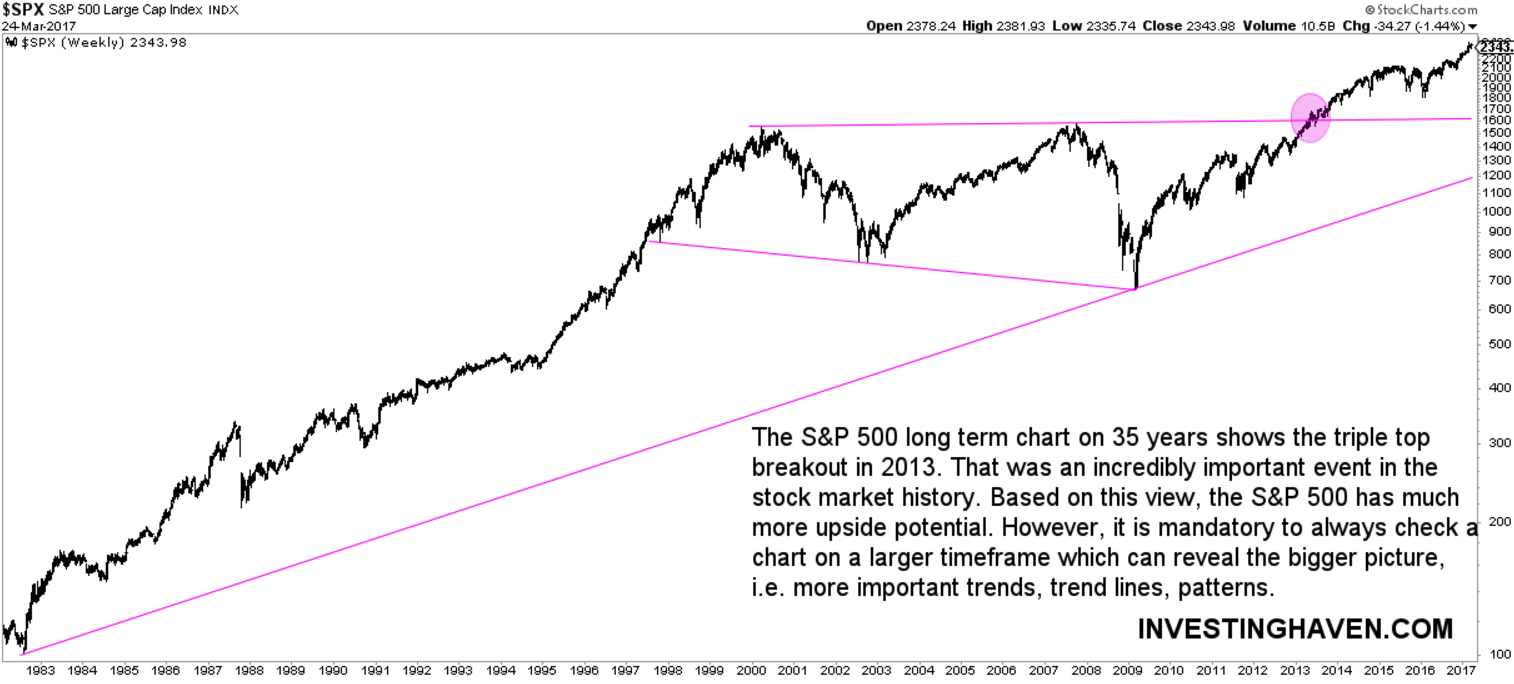
35-year stock market chart of the S&P 500

First, the 35-year chart of the S&P 500 reveals a hugely bullish chart formation. Most believe that the US stock market entered a bear market in 2000. That is partly true though. The long term stock market chart shows a double top combined with lower lows. However, after the 2009 lows, stocks moved higher, and set a triple top. That was followed by a breakout, and as it took 13 years to break out we can say it was a ‘secular breakout’.

The 35-year chart suggests much more upside potential.

3 long term stock market charts

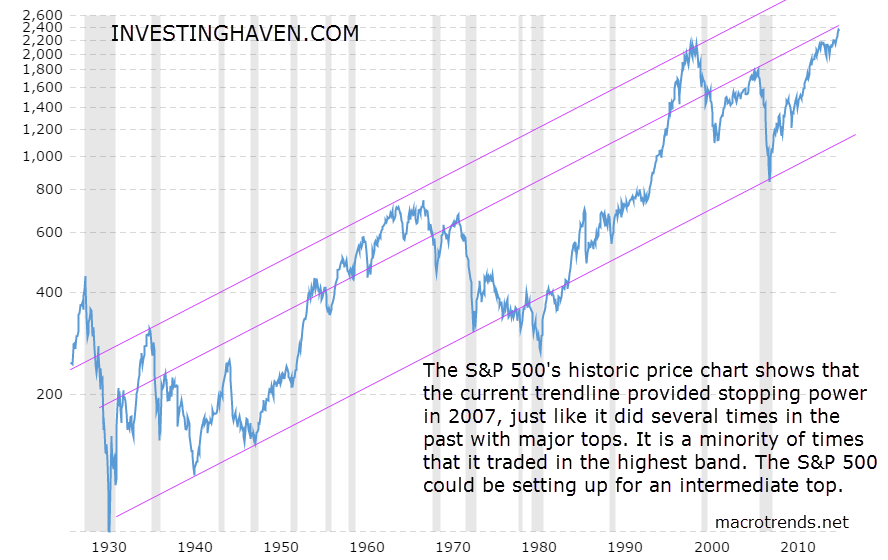
Long term stock market charts inflation-adjusted on 100 years

When zooming out to a 100-year timeframe, the chart pattern becomes totally different. One important thing to note: this represents the inflation-adjusted chart using the headline CPI (each data point represents the month-end closing value).

We should be careful comparing both charts, as they cannot compared one-to-one. The inflation-adjusted chart could potentially provide an additional insight though.

What can we derive from the 100-year inflation-adjusted chart? The very long term trend channel is an important observation. More importantly, however, is the secondary trendline, which connects several important tops in the last 100 years. Right now, the S&P 500 is testing that trendline.

Moreover, it is was only a minority of times that the S&P 500 was trading in the highest ‘band’, above the trend line that is being tested right now.

Although one cannot rely on this inflation-adjusted chart as the only indicator, it could provide additional insights. The message of this chart is that current prices could be an intermediate top. We have to combine this chart with chart patterns on other markets though, like long term Yields which we consider a leading indicator.

the s&p500 long term stock market chart

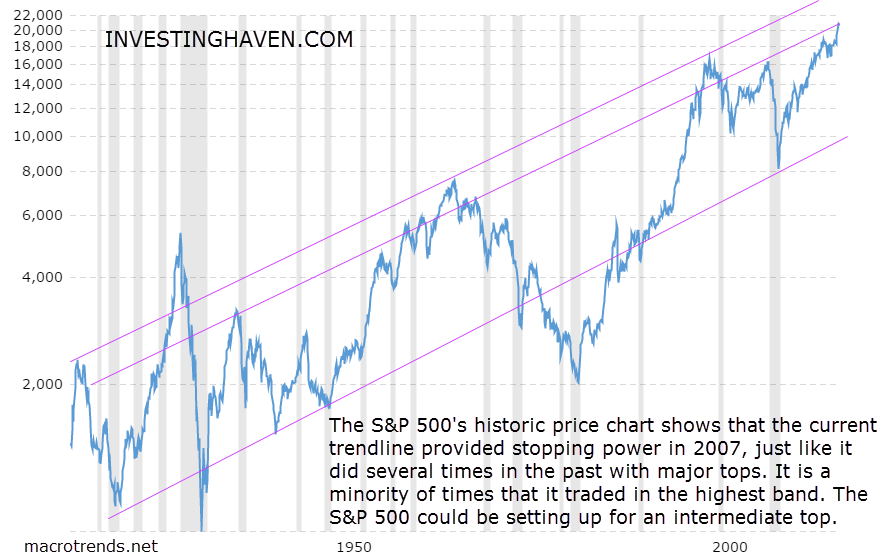
The Dow Jones Industrial makes a similar point, just much stronger. The pattern is even more explicit on the Dow Jones chart.

the dow jones long term stock market chart

Which argument do we see suggesting stock markets have reached an intermediate top? Our leading indicator, 10-year Yields, is forming a unique pattern. As indicated in red, Yields could be making a huge double bottom, and that has not occurred in the last 4 decades!

The very long term downtrend in Yields since 1980 coincides with the very long term bull market in stocks. However, Yields are very close to a secular breakout. If that breakout were to occur, we would be in uncharted territory, and stocks could indeed be suffering, underpinning a topping scenario in stocks. In other words, investors watch closely current levels in 10-year Yields.

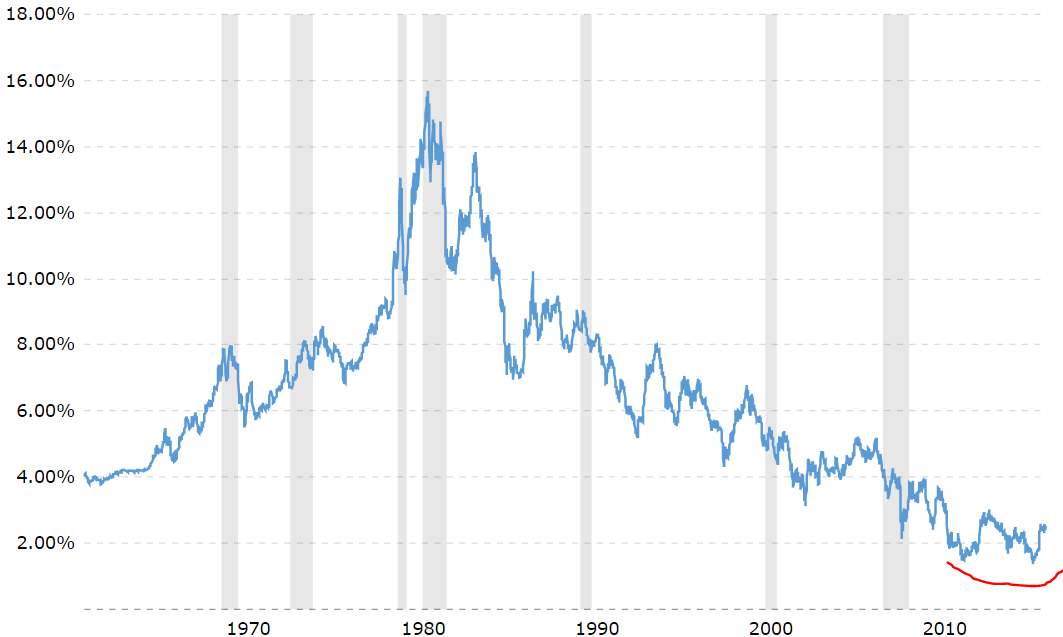
Chart courtesy: macrotrends.net

Receive our weekly newsletter.

*We hate spam as you do.

premium service trade alerts   premium service trade alerts   premium service crypto teaser  
WARNING: InvestingHaven.com, our site, is not affiliated and has no connection whatsoever with Invest Haven Group on Invest-Haven.com or Investing-Haven.com. InvestingHaven.com did not have and will never have sales reps. Do not accept financial offers, certainly not by telephone, this is why >>
Taki Tsaklanos

Taki Tsaklanos

Taki has +15 years of experience in global markets. His methodology is unique and effective, yet easy to understand; it is based on chart analysis combined with intermarket / fundamental / sentiment analysis. His work appeared on major financial outlets like FinancialSense, MarketWatch, ... Email: taki.tsaklanos@gmail.com. Twitter: twitter.com/investinghaven

Latest

stocks forecast

How To Know When The S&P 500 Confirms A Bullish Turning Point?

September 28, 2023
cryptocurrency forecast prediction

The Most Bullish Cryptocurrency Chart Setup Of October 2023

September 28, 2023
leading indicators

Will The S&P 500 Find Support At Its 200 Day Moving Average?

September 24, 2023
uranium stocks

Is The Breakout In The Uranium Market Confirmed?

September 24, 2023

Connect with InvestingHaven

Receive top notch forecasts for free.

*We hate spam as you do.

Categories

  • 2023 Forecasts
  • Stocks
  • Commodities
  • Silver
  • Lithium
  • Crypto

Site Navigation

  • RSS Feed
  • About us
  • Mission 2026
  • Sitemap
  • Privacy & Disclaimer
  • Terms of Service
  • InvestingHaven vs. Invest-Haven
  • Contact Us
Investing
Haven

Top notch forecasting with gold price forecast, many stock predictions, cryptocurrency charts. Many investing tips and crypto market analysis.

Copyright © 2023 InvestingHaven

No Result
View All Result
  • 2023 Forecasts
  • Stock market
  • AI Stocks
  • Alternative Energy
  • Lithium Articles
  • Lithium Stocks
  • Silver Articles
  • Silver Stocks
  • Crypto Articles
  • Premium Crypto Research
  • Premium Services & MyAccount

Copyright © 2023 InvestingHaven

Login to your account below

Forgotten Password?

Fill the forms bellow to register

All fields are required. Log In

Retrieve your password

Please enter your username or email address to reset your password.

Log In

    InvestingHaven.com honours your privacy. Read our Privacy Policy