Investing Haven
No Result
View All Result
Gold Silver Investing >>
CRYPTO INVESTING >>
  • 2025 Forecasts
    • 10 market predictions
    • Dow Jones forecast
    • S&P 500 forecast 2025
    • Nasdaq prediction 2025
    • Best altcoins to buy
    • Best crypto to buy now
    • Which crypto will explode
    • 15 crypto forecasts 2025
    • Which precious metal to buy
  • Silver
    • Silver prediction 2025 – 2030
    • Will silver exceed $30?
    • When will silver hit $50?
    • Can silver hit $100?
    • Silver shortage
    • 50-year silver chart
    • Silver bullish reversal
    • Silver seasonality charts
    • How to invest in silver
  • Gold
    • Gold prediction 2025 – 2030
    • Will gold set new ATH?
    • Will gold hit $3,000?
    • Can gold hit $10,000?
    • Gold chart 10 years
    • Gold chart 50 years
    • Gold chart 100 years
    • Gold silver ratio
    • Gold seasonality charts
  • Commodities
    • Coffee forecasts
    • Sugar forecasts
    • Nickel forecasts
    • Lithium investing
  • Crypto forecasts
    • BTC prediction 2025 – 2030
    • ETH prediction 2025 – 2030
    • SOL prediction 2025 – 2030
    • XRP prediction 2025 – 2030
    • XLM prediction 2025 – 2030
    • BNB prediction 2025 – 2030
    • ADA prediction 2025 – 2030
    • AVAX prediction 2025 – 2030
    • KAS prediction 2025 – 2030
    • NEAR prediction 2025 – 2030
    • BCH prediction 2025 – 2030
    • LINK prediction 2025 – 2030
    • DOT prediction 2025 – 2030
    • SUI prediction 2025 – 2030
    • ICP prediction 2025 – 2030
    • LTC prediction 2025 – 2026
    • STX prediction 2025 – 2030
    • DOGE prediction 2025 – 2030
    • SHIB prediction 2025 – 2030
    • PEPE prediction 2025 – 2030
    • FLOKI prediction 2025 – 2030
    • WIF prediction 2025 – 2030
    • ONDO prediction 2025 – 2030
  • News
    • Crypto news
    • Commodities
  • Login
Investing Haven
No Result
View All Result

Home » Trendwatching » The Gold And Silver Bull Market Of 2018 About To Start

The Gold And Silver Bull Market Of 2018 About To Start

Taki T. by Taki T.
November 28, 2023
in Trendwatching
gold price bullish
2.1k
VIEWS
Share on FacebookShare on Twitter

What a difference 6 months can make in the gold market. In October of last year we were looking at bearish gold price forecast for 2018. It was an assessment based on a deep analysis, not on emotions (pro vs anti gold) nor on a dogmatic belief like some perma bears or perma bulls. As always, we try to neutralize emotions and news, which both serve as noise, in order to stay focused on our methodology. Given the evolution in the last 6 months we cleary see the first signs of a new bull market in gold and silver starting in 2018, this is why.

Before looking into the bull market signs of 2018 we want to point out that our objective viewpoint comes back in every forecast we make. Again, we are not perma bulls nor perma bears. This is what we wrote in the 2018 gold price forecast:

We see 3 potential scenarios related to the price of gold playing out in 2018, which we discuss in this article. We highlight which scenario we believe is likely to play out, and which price levels to watch to validate either of our scenarios.

Our bearish gold price forecast was based on a couple of criteria, one of which being the price. The line in the sand in 2018 is $1350 which is what we wrote last year.

Not only is the price of gold moving gradually to $1350 with a pattern of higher lows, which shows strength, but also do we see much more frequent attempts to test this level. The ultimate pattern which makes this point is the rounded bottom which we featured in this gold article.

This is one of the two new insights we got from the gold market since we wrote our article last year.

And here is the second, even more important, insight: the gold futures market structure visible in the COTs (Commitment of Traders reports).

A strong sign of an emerging gold bull market in 2018

The price of gold is largely defined by the futures market. Whether this is gold price manipulation is not relevant for this discussion, it’s outside of our scope and our interest of this article. What matters to investors is which leading signals we can recognize in the gold futures market structure.

The most important insight in the futures market is this: what is the futures size position of the commercial traders on the same price level over time.

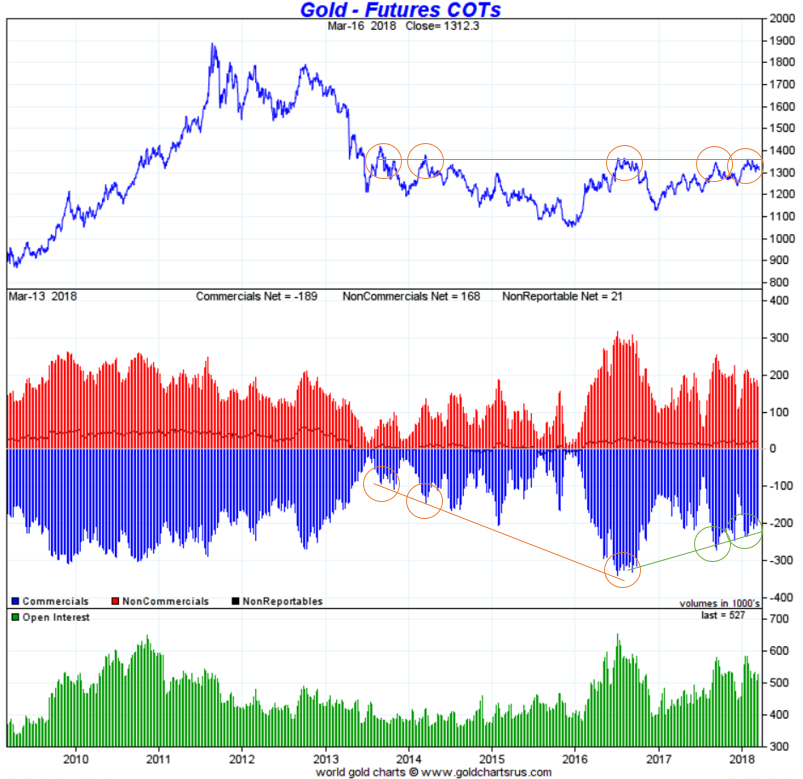
Let’s apply this to the 9-year chart. The $1350 level, you know, the one we outlined above and in our gold price forecast last year, is indicated over the last 4 years with the 5 red circles on the price chart below. The corresponding volume of short positions of commercial traders is visible in the lower pane. Do you see the pattern switch which started in the same month as we wrote our gold price forecast? At that point in time we were still looking at the bearish trend. However, since then, the level of short positions is decreasing every time gold comes close to $1350.

What does this mean? Short positions of commercials provide stopping power to the gold price. In other words, every time gold comes close to the $1350 level there is increasingly less stopping power. This implies the gold price will sooner rather than later break through the Chinese wall of $1350, and break out of the 7-year bear market!

We believe this breakout will take place in the coming months, for sure in 2018!

An even more explosive sign in the silver market

Similarly, the silver market has the same setup but it looks even more explosive. Note how big the difference is in the short positions of commercial traders between last October and today on a silver (SILVER) price that is trading just 10 to 15% lower.

The silver market looks like a giant pressure cooker. Once gold breaks out we believe silver will outperform but we preserve the right to revise this forecast depending on how fast commercial traders add to their short positions (blue bars on below chart).

10-YEAR ANNIVERSARY OFFER: InvestingHaven.com celebrates 10 years. Temporarily, you can enjoy a discount on our premium gold/silver and crypto reports. Or you can become a VIP member. Go to our anniversary deals >>
Receive our weekly newsletter.

premium service SP-500 premium service trade alerts premium service crypto teaser 

No related posts.

Tags: GOLDSILVER
Taki T.

Taki T.

Taki is a chart analyst who is passionate about unlocking unique insights out the chart. While the vast majority of analysts remain focused on price analysis, Taki starts with timeline analysis and adds price analysis to this. In doing so, he developed a unique methodology to find opportunities in financial markets, across assets and markets.

Leave a Reply Cancel reply

Your email address will not be published. Required fields are marked *

Connect with InvestingHaven

Receive top notch forecasts for free.

*We hate spam as you do.

Site Navigation

  • RSS Feed
  • About us
  • Advertising
  • Sponsored Content Policy
  • Mission 2026
  • Sitemap
  • Privacy & Disclaimer
  • Terms of Service
  • Contact Us
investing haven logo

Precious metals market analysis including gold and silver price predictions. Crypto market analysis including highly accurate BTC ETH SOL XRP forecasts.

Copyright © 2025 InvestingHaven

Login to your account below

Forgotten Password?

Fill the forms bellow to register

All fields are required. Log In

Retrieve your password

Please enter your username or email address to reset your password.

Log In

Receive top notch forecasts for free.

*We hate spam as you do.

No Result
View All Result
  • News
  • 2025 Forecasts
    • 10 market predictions
    • Dow Jones forecast 2025
    • S&P 500 forecast 2025
    • Nasdaq prediction 2025
    • Best crypto to buy now
    • Which crypto will explode
    • Best altcoins to buy
    • 15 crypto forecasts 2025
    • Which precious metal to buy
  • Silver articles
    • Silver prediction 2025 – 2030
    • Will silver exceed $30?
    • When will silver hit $50?
    • Can silver hit $100?
    • Silver shortage
    • 50-year silver chart
    • Silver bullish reversal
    • Silver seasonality charts
    • How to invest in silver
  • Gold
    • Gold prediction 2025 – 2030
    • Will gold set new ATH?
    • Will gold hit $3,000?
    • Can gold hit $10,000?
    • Gold chart 10 years
    • Gold chart 50 years
    • Gold chart 100 years
    • Gold silver ratio
    • Gold seasonality charts
  • Commodities
    • Sugar forecasts
    • Coffee forecasts
    • Nickel forecasts
    • Lithium investing
  • Crypto news
  • Crypto forecasts
    • BTC prediction 2025 – 2030
    • ETH prediction 2025 – 2030
    • SOL prediction 2025 – 2030
    • XRP prediction 2025 – 2030
    • XLM prediction 2025 – 2030
    • BNB prediction 2025 – 2030
    • ADA prediction 2025 – 2030
    • AVAX prediction 2025 – 2030
    • KAS prediction 2025 – 2030
    • NEAR prediction 2025 – 2030
    • BCH prediction 2025 – 2030
    • LINK prediction 2025 – 2030
    • DOT prediction 2025 – 2030
    • SUI prediction 2025 – 2030
    • ICP prediction 2025 – 2030
    • LTC prediction 2025 – 2026
    • STX prediction 2025 – 2030
    • DOGE prediction 2025 – 2030
    • SHIB prediction 2025 – 2030
    • PEPE prediction 2025 – 2030
    • FLOKI prediction 2025 – 2030
    • WIF prediction 2025 – 2030
    • ONDO prediction 2025 – 2030
  • Premium Crypto Alerts
  • Premium services

Copyright © 2025 InvestingHaven