On October 13th, the day SPX opened below 3500 points, the entire investor community expected a market crash. It did not happen, the opposite happened. We wrote The Market Will Not Move 50% Lower Contrary To What The Gurus Are Telling You, the S&P 500 went from 3500 points to 4045 points in a matter of 4 weeks. This current setups smells like it is time for a pullback. That’s how it goes: when the market starts breaking down, the majority of investors is selling. Now that it ‘feels’ safer, the market is probably going to shake most investors out in a pullback. Case in point: the 100 year Dow Jones trendline might be tested as support in the short term.
2022 has been an awful year for most investors. They sold at the wrong moment, they bought at the wrong moment. Our estimate is that 50% of investors fell into this market trap. We don’t have data to back this up, it’s a gut feeling.
One of the underlying drivers of the problem is that investors cannot stand positions that are ‘underwater’. While it is no fun looking at an account with positions ‘in red’ it should always be looked at in the right context. A position that is ‘underwater’ is not necessarily a bad thing if it is temporary, however it might never recover.
It is not easy to know exactly whether a position will recover, much depends on sector momentum as well as growth outlook.
If we apply this to the current situation, we see that last week’s CPI and this week’s PPI data came out softer than expected. Great, the market reacted in a positive way. So, this ‘feels’ like it is getting a safer place, right?
That’s when the market is going to act in a counter-intuitive way. Remember what we said in 7 Secrets of Successful Investing.
That said, let’s look at the charts of leading stock indexes.
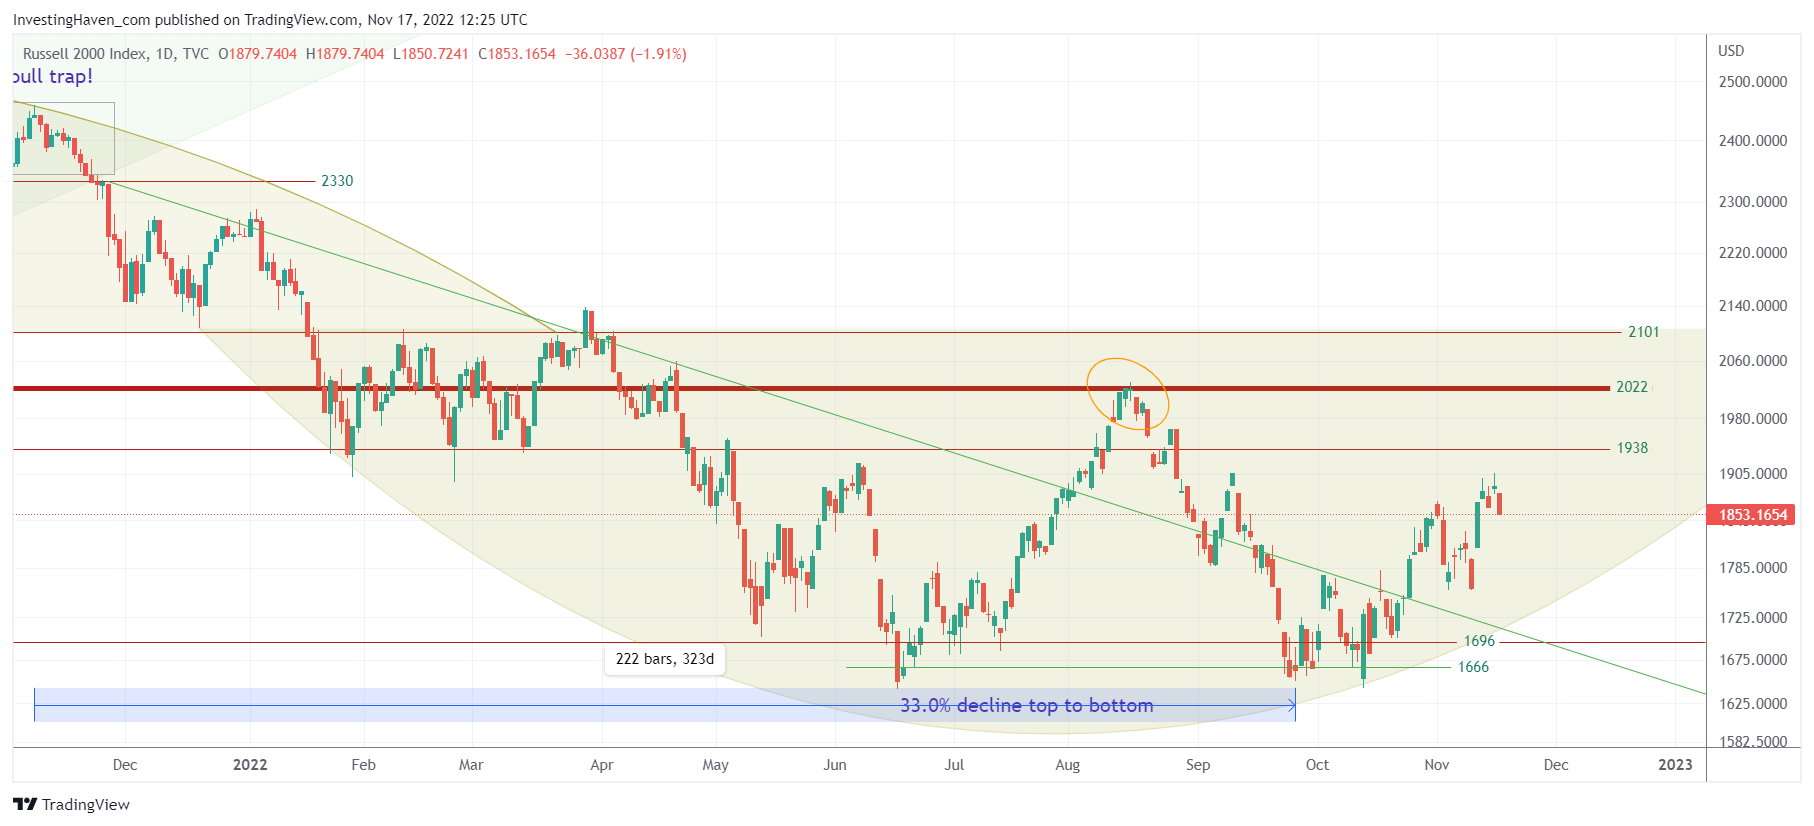
The Russell 2000 might go back to the lower 1700ies before it moves to 2022 in 2023.
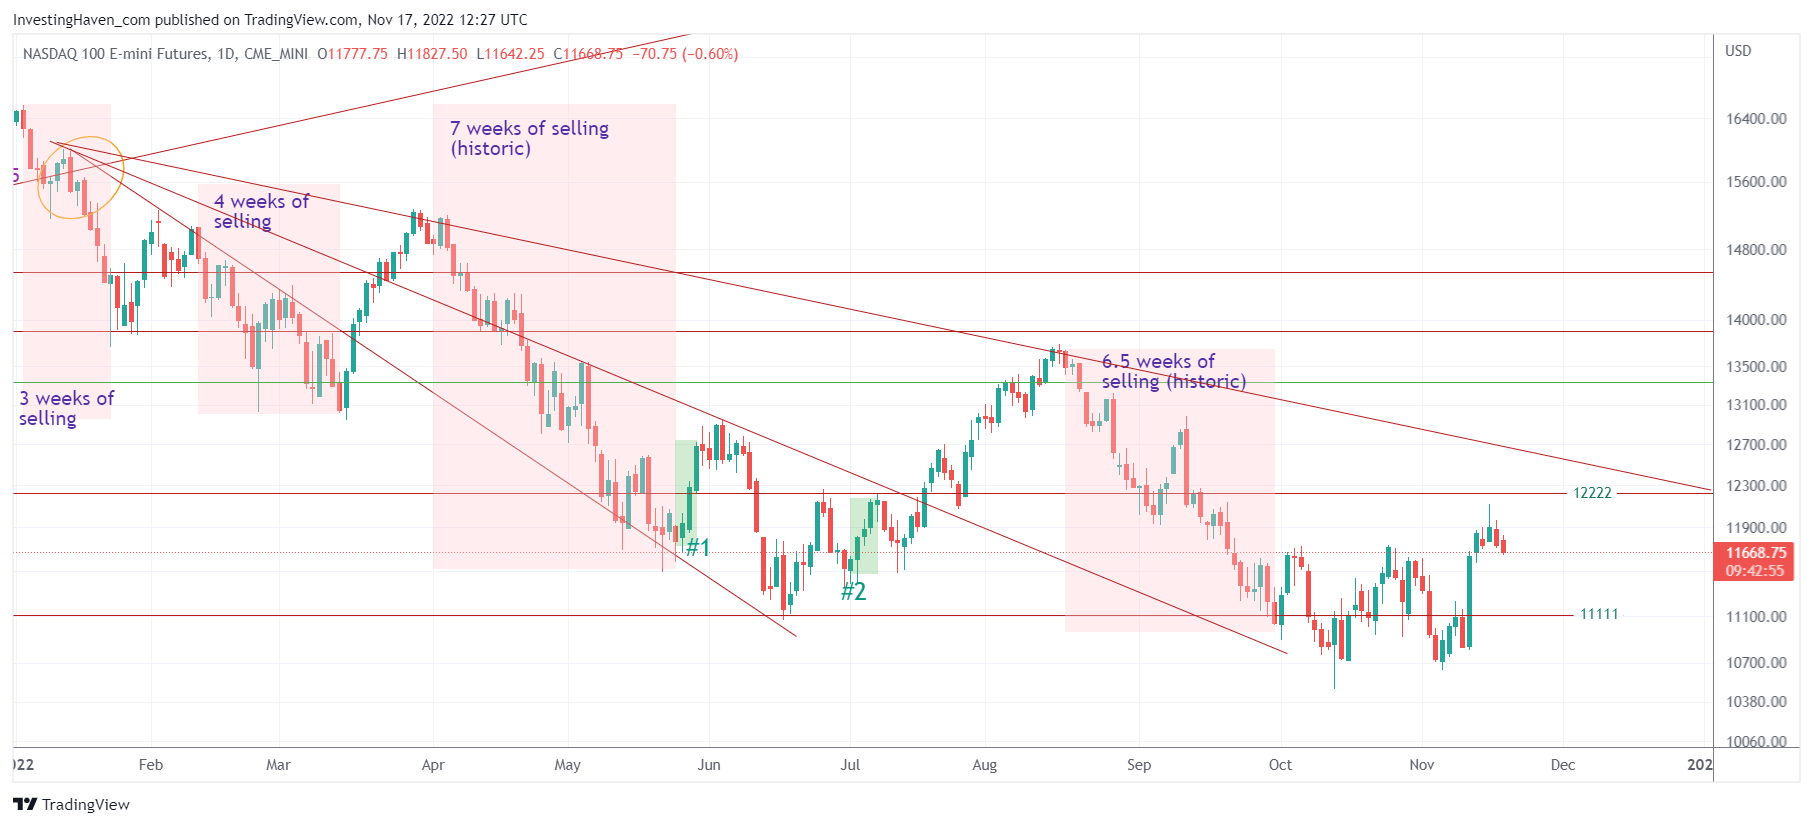
The Nasdaq might go back to 1111 before it moves back to 12200 and 13500 in 2023.
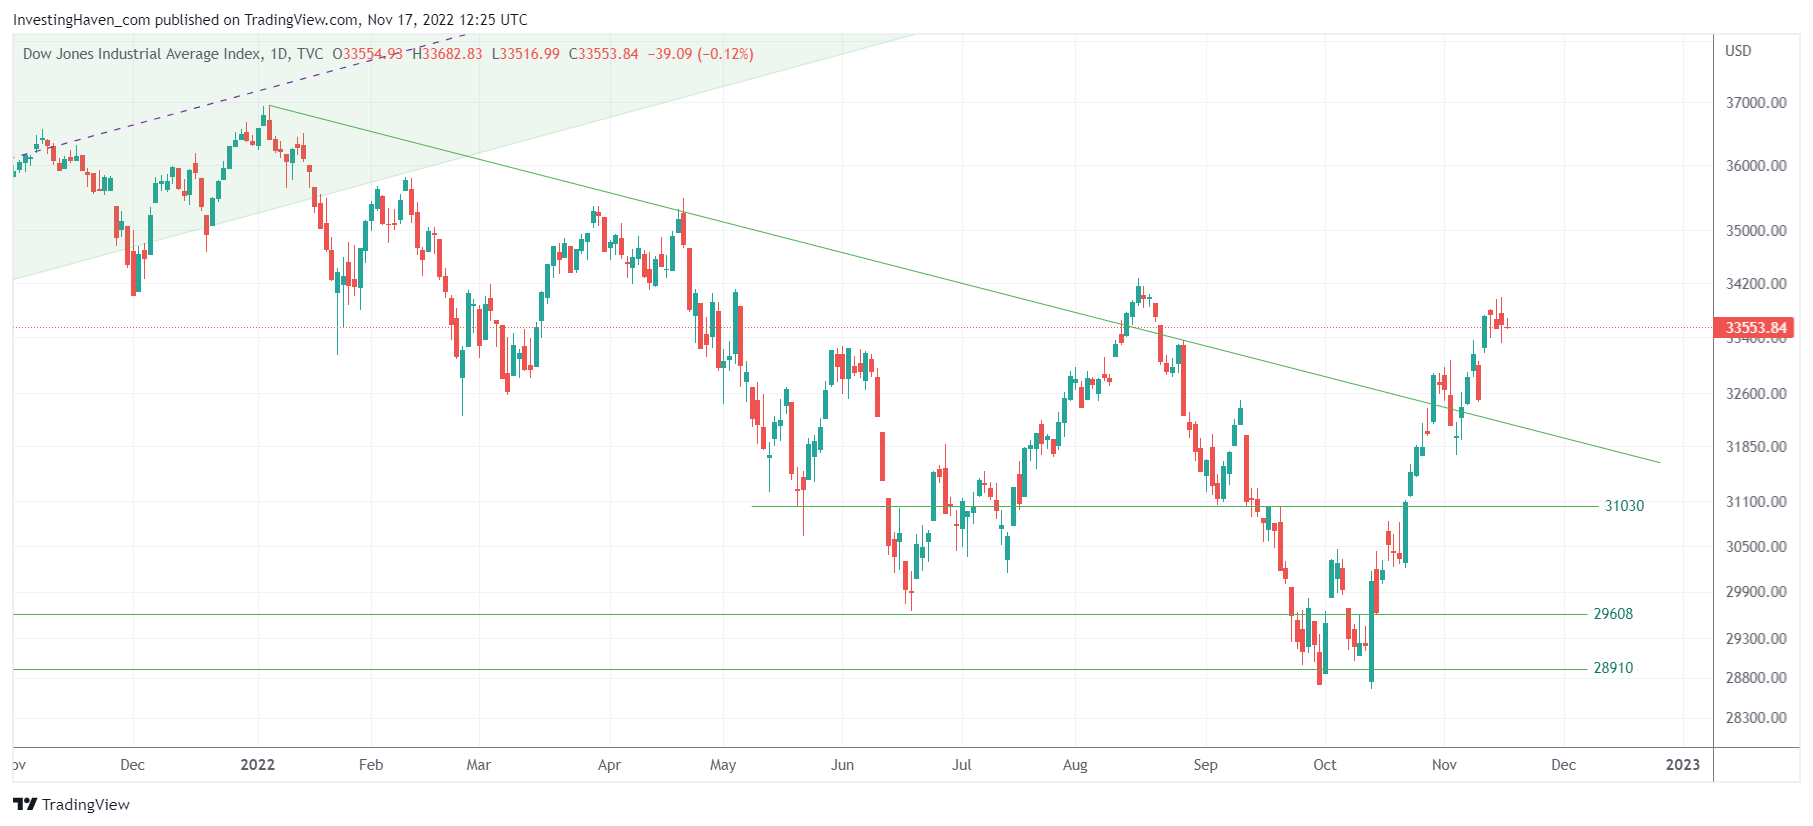
The Dow Jones, currently the strongest of the 4 U.S. indexes, is likely to move back to 31.8k before moving back to 35k. That’s where the 100 year trendline comes in.


