Investing Haven
No Result
View All Result
Gold Silver Investing >>
CRYPTO INVESTING >>
  • 2025 Forecasts
    • 10 market predictions
    • Dow Jones forecast
    • S&P 500 forecast 2025
    • Nasdaq prediction 2025
    • Best altcoins to buy
    • Best crypto to buy now
    • Which crypto will explode
    • 15 crypto forecasts 2025
    • Which precious metal to buy
  • Silver
    • Silver prediction 2025 – 2030
    • Will silver exceed $30?
    • When will silver hit $50?
    • Can silver hit $100?
    • Silver shortage
    • 50-year silver chart
    • Silver bullish reversal
    • Silver seasonality charts
    • How to invest in silver
  • Gold
    • Gold prediction 2025 – 2030
    • Will gold set new ATH?
    • Will gold hit $3,000?
    • Can gold hit $10,000?
    • Gold chart 10 years
    • Gold chart 50 years
    • Gold chart 100 years
    • Gold silver ratio
    • Gold seasonality charts
  • Commodities
    • Coffee forecasts
    • Sugar forecasts
    • Nickel forecasts
    • Lithium investing
  • Crypto forecasts
    • BTC prediction 2025 – 2030
    • ETH prediction 2025 – 2030
    • SOL prediction 2025 – 2030
    • XRP prediction 2025 – 2030
    • XLM prediction 2025 – 2030
    • BNB prediction 2025 – 2030
    • ADA prediction 2025 – 2030
    • AVAX prediction 2025 – 2030
    • KAS prediction 2025 – 2030
    • NEAR prediction 2025 – 2030
    • BCH prediction 2025 – 2030
    • LINK prediction 2025 – 2030
    • DOT prediction 2025 – 2030
    • SUI prediction 2025 – 2030
    • ICP prediction 2025 – 2030
    • LTC prediction 2025 – 2026
    • STX prediction 2025 – 2030
    • DOGE prediction 2025 – 2030
    • SHIB prediction 2025 – 2030
    • PEPE prediction 2025 – 2030
    • FLOKI prediction 2025 – 2030
    • WIF prediction 2025 – 2030
    • ONDO prediction 2025 – 2030
  • News
    • Crypto news
    • Commodities
  • Login
Investing Haven
No Result
View All Result

3 Must-See Charts On The Breakdown Of The Bond Bull Market

Taki Tsaklanos by Taki Tsaklanos
October 6, 2018
in Markets & Stocks

Home » Markets & Stocks » 3 Must-See Charts On The Breakdown Of The Bond Bull Market

2k
VIEWS
Share on FacebookShare on Twitter

It is confirmed. The breakdown of the bond bull market which lasted almost 4 decades is now a fact. We wrote about it earlier this week in Major Turning Point: End Of 40-Year Bull Market In Bonds but the confirmation was not there yet. Now it is. This article includes 3 must-see charts on the breakdown of the bond bull market, and what it may imply going forward.

Note the breakdown of the bond bull market is a major theme. It is a once-in-a-decade type of market event. Moreover, it is a once-in-a-generation turnaround in the bond market. We will provide lots of coverage on how this plays out.

Needless to say, the breakdown of the bond bull market should be the number one priority on every investor’s mind.

Breakdown Of The Bond Bull Market: What Does This Mean?

Let’s repeat what we said earlier in our article mentioned above:

In other words, a massive level of capital, never seen before, in the order of $40 trillion, will start moving around. Obviously, not all of it, but a considerable part will move elsewhere. Can anyone imagine what will happen if this becomes a trend into the same direction. Correct: stampede.

There will be major capital flows out of the bond market into other markets. The trillion-dollar question is: where exactly will money flow into.

Anyone is free to forecast what may happen, but this is a classic case in which only the market and time will tell. All our 2019 market forecasts may get invalidated if the market takes the unexpected path of bonds down with stocks down with commodities down.

In other words please be careful when you read articles like this one bond market sell-off weighs on stocks on Financial Times or any other financial media site. Although they are to the point for that one specific day they described it is the mid to long term impact that investors must watch.

Breakdown Of The Bond Bull Market: TLT Breakdown

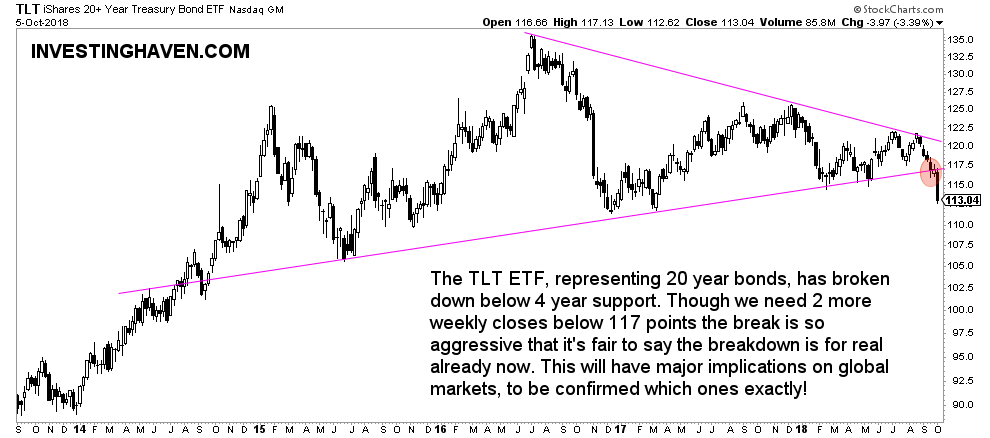
First, the bond market confirmed its breakdown this week, as seen on the TLT chart.

The TLT ETF, representing 20 year bonds, has broken down below 4 year support. Though we need 2 more weekly closes below 117 points the break is so aggressive that it’s fair to say the breakdown is for real already now. This will have major implications on global markets, to be confirmed which ones exactly!

breakdown of the bond bull market

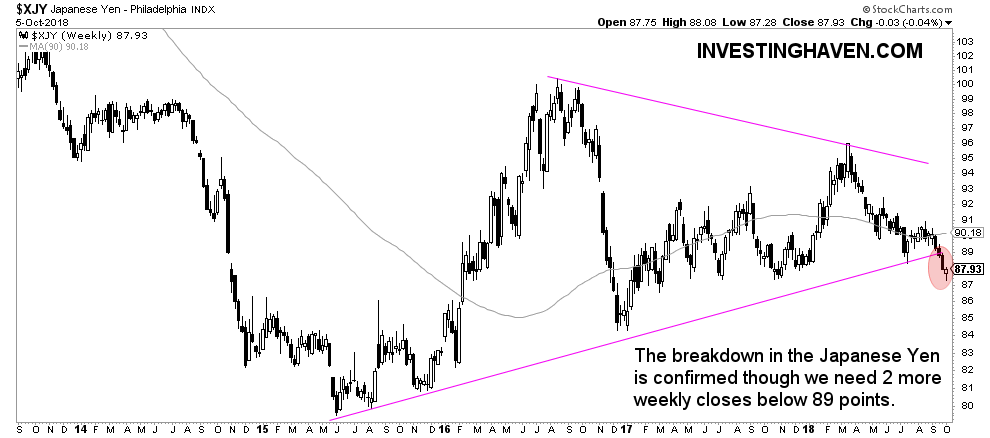
Breakdown Of The Bond Bull Market: Yen Breakdown

Second, it is clear, so far, that safe havens did not get a bid. The first capital outflow of TLT did not go into the Yen, a very intuitive market that would get a safe have bid.

The Yen breaks down on its weekly chart. Note, though, it did not break down on its monthly though.

Also the Swiss Franc got hit hard this week as seen on this chart.


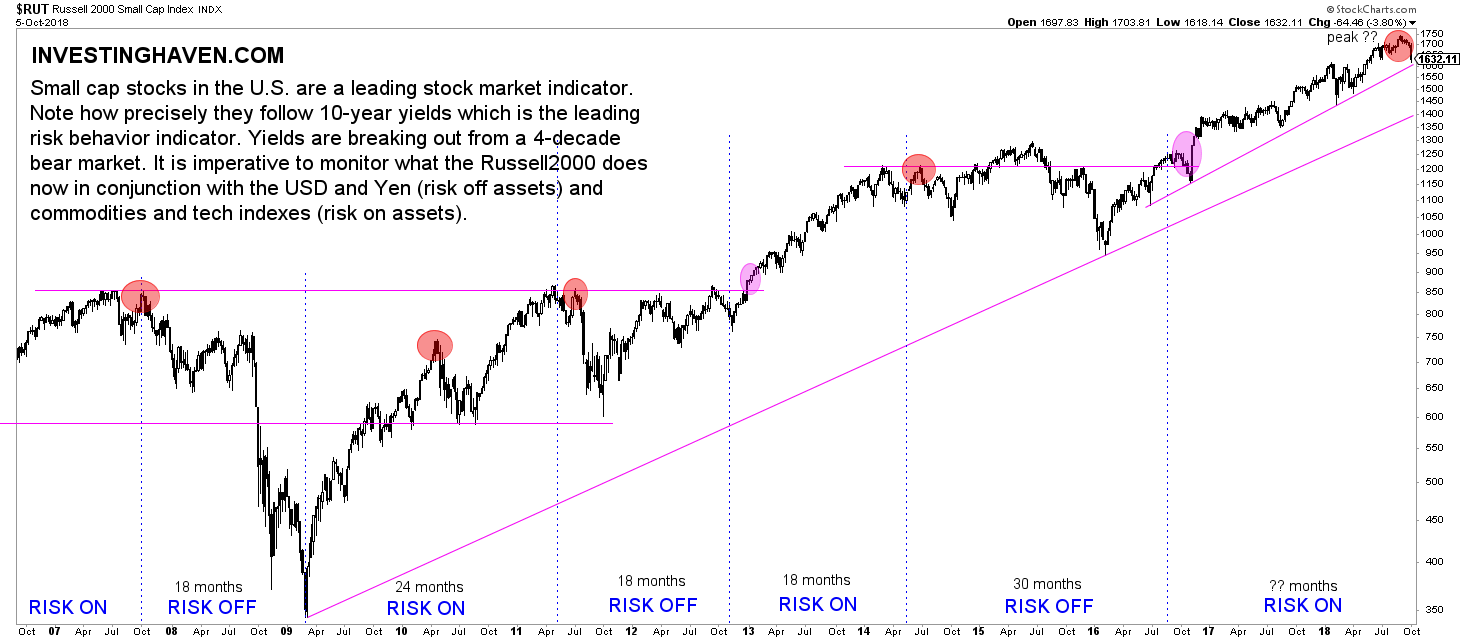
Breakdown Of The Bond Bull Market: Russell 2000 at make-or-break level

After the 3.8% retracement in the U.S. small cap stocks index Russell 2000 it is important now to watch the effect on stock markets.

The first effect, in the same week the bond market broke down, is negative on stocks. Note, however, that one week does not make a market. U.S. stocks still trade in their long term bull market. But will they continue to do so?

Presumably “yes” is our answer because the bond market exodus implies a risk-on sentiment. 

Still, we must see all stock bull market levels respected, and that’s why we will watch this space closely in the next few weeks and months. Only time will tell, but, as said, this is by far the most important theme in markets. Resolution will become clear, but stay focused and certainly open minded in this type of market environment.

US small cap stocks weekly october 2018

10-YEAR ANNIVERSARY OFFER: InvestingHaven.com celebrates 10 years. Temporarily, you can enjoy a discount on our premium gold/silver and crypto reports. Or you can become a VIP member. Go to our anniversary deals >>
Receive our weekly newsletter.

premium service SP-500 premium service trade alerts premium service crypto teaser 

No related posts.

Tags: TLT
Taki Tsaklanos

Taki Tsaklanos

Taki has +15 years of experience in global markets. He is passionate about forecasting markets - he calls it THE ART OF FORECASTING. His analysis methodology is unique and effective, yet easy to understand; it is based on chart analysis combined with intermarket / fundamental / sentiment analysis. His work appeared on major financial outlets like FinancialSense, MarketWatch,Twitter: twitter.com/investinghaven

Connect with InvestingHaven

Receive top notch forecasts for free.

*We hate spam as you do.

Site Navigation

  • RSS Feed
  • About us
  • Advertising
  • Sponsored Content Policy
  • Mission 2026
  • Sitemap
  • Privacy & Disclaimer
  • Terms of Service
  • Contact Us
investing haven logo

Precious metals market analysis including gold and silver price predictions. Crypto market analysis including highly accurate BTC ETH SOL XRP forecasts.

Copyright © 2025 InvestingHaven

Login to your account below

Forgotten Password?

Fill the forms bellow to register

All fields are required. Log In

Retrieve your password

Please enter your username or email address to reset your password.

Log In

Receive top notch forecasts for free.

*We hate spam as you do.

    InvestingHaven.com honours your privacy. Read our Privacy Policy

    No Result
    View All Result
    • News
    • 2025 Forecasts
      • 10 market predictions
      • Dow Jones forecast 2025
      • S&P 500 forecast 2025
      • Nasdaq prediction 2025
      • Best crypto to buy now
      • Which crypto will explode
      • Best altcoins to buy
      • 15 crypto forecasts 2025
      • Which precious metal to buy
    • Silver articles
      • Silver prediction 2025 – 2030
      • Will silver exceed $30?
      • When will silver hit $50?
      • Can silver hit $100?
      • Silver shortage
      • 50-year silver chart
      • Silver bullish reversal
      • Silver seasonality charts
      • How to invest in silver
    • Gold
      • Gold prediction 2025 – 2030
      • Will gold set new ATH?
      • Will gold hit $3,000?
      • Can gold hit $10,000?
      • Gold chart 10 years
      • Gold chart 50 years
      • Gold chart 100 years
      • Gold silver ratio
      • Gold seasonality charts
    • Commodities
      • Sugar forecasts
      • Coffee forecasts
      • Nickel forecasts
      • Lithium investing
    • Crypto news
    • Crypto forecasts
      • BTC prediction 2025 – 2030
      • ETH prediction 2025 – 2030
      • SOL prediction 2025 – 2030
      • XRP prediction 2025 – 2030
      • XLM prediction 2025 – 2030
      • BNB prediction 2025 – 2030
      • ADA prediction 2025 – 2030
      • AVAX prediction 2025 – 2030
      • KAS prediction 2025 – 2030
      • NEAR prediction 2025 – 2030
      • BCH prediction 2025 – 2030
      • LINK prediction 2025 – 2030
      • DOT prediction 2025 – 2030
      • SUI prediction 2025 – 2030
      • ICP prediction 2025 – 2030
      • LTC prediction 2025 – 2026
      • STX prediction 2025 – 2030
      • DOGE prediction 2025 – 2030
      • SHIB prediction 2025 – 2030
      • PEPE prediction 2025 – 2030
      • FLOKI prediction 2025 – 2030
      • WIF prediction 2025 – 2030
      • ONDO prediction 2025 – 2030
    • Premium Crypto Alerts
    • Premium services

    Copyright © 2025 InvestingHaven