Investing
Haven
No Result
View All Result
Sunday, May 28, 2023
  • Login
  • 2023 Forecasts
  • Stocks
  • Commodities
  • Silver
  • Lithium
  • Crypto
stock market tips >>
Investing
Haven
  • 2023 Forecasts
  • Stocks
  • Commodities
  • Silver
  • Lithium
  • Crypto
No Result
View All Result
InvestingHaven
No Result
View All Result

What’s Next For Tech Stocks: Pullback, Crash, Bull Run?

by Taki Tsaklanos
April 09, 2023
in Markets & Stocks
0
Tags: QQQsymbolsXLK
technology stocks
1.9k
VIEWS
Share on FacebookShare on Twitter

The technology sector has been one of the hottest areas of the stock market in 2023, in line with our 2023 forecasts. It looks like there is a renewed interest by investors to pour money into tech stocks, after the cataclysmic tech bear market last year. The Dow Jones may have done well towards the end of last year, but this year, so far, has been the year of tech stocks. But with tech stocks rising nicely in recent months, many investors are wondering what’s next for this sector.

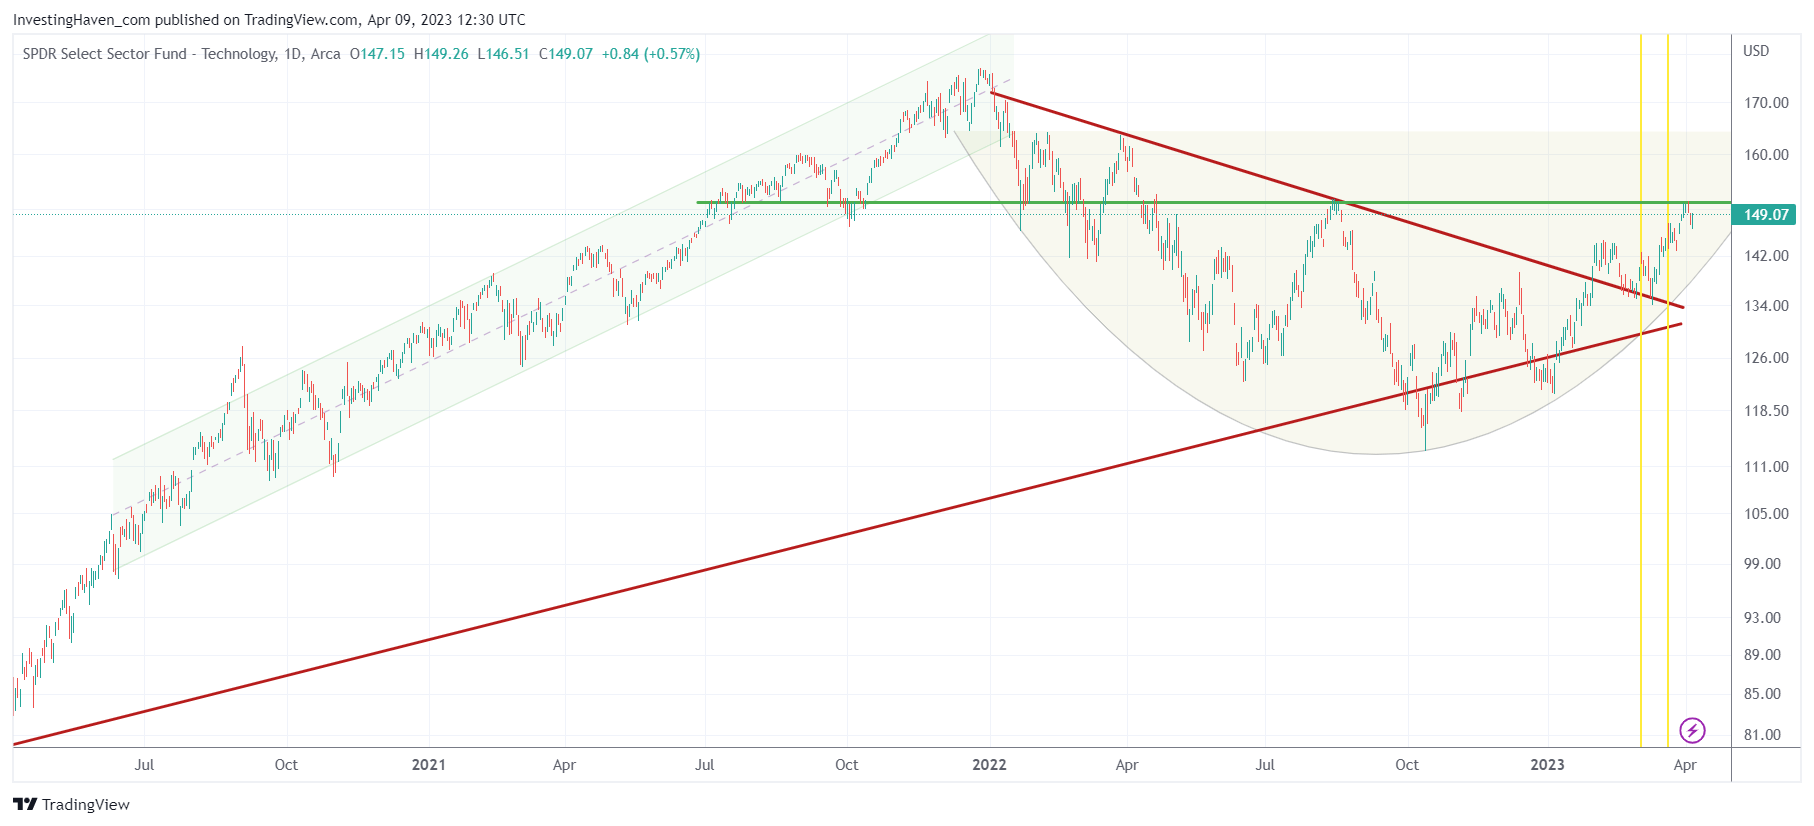
To answer that question, let’s take a closer look at the XLK ETF, which tracks the performance of the technology sector. Looking at the longer-term, three-year chart of XLK, we can see that the ETF recently broke through a falling trendline that had characterized the 2022 bear market. This bullish reversal took the form of a rounded pattern, indicating that the trend may be reversing from bearish to bullish.

Additionally, our predicted volatility window ended on March 24th, the day XLK successfully tested the falling trendline. The yellow lines on the chart represent our predicted volatility window. Note, also, how our March 5th contrarian buy signal for long term investors worked like clockwork. Currently, XLK is hitting the exact same level that was hit in August as resistance, at around 150 points.

tech stocks

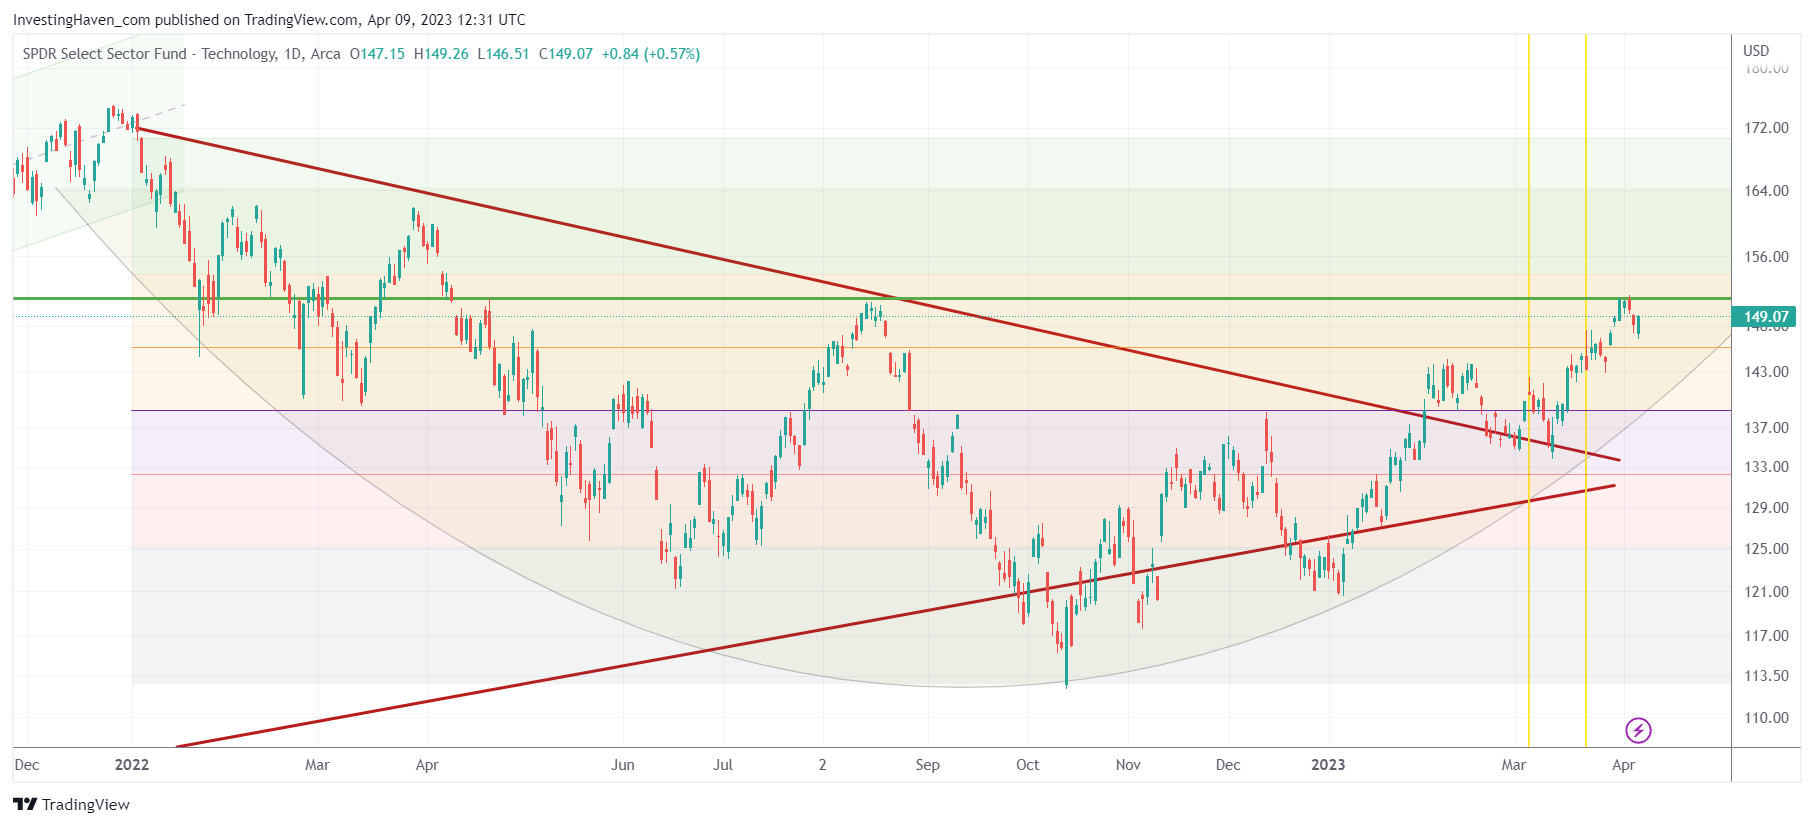
Moving to the shorter-term, one-year chart of XLK, we can see that the ETF is now trading around the 38.2% retracement level, marked by a fine orange line on the chart. Readings above the 50% retracement level can be considered bullish, and the probability of a bull run is much higher once the 50% retracement level is cleared.

There are several key takeaways from these charts. First, XLK is currently trading between the 50% and 38.2% retracement levels, which is within the rounded pattern and therefore, bullish. The probability of a steep drop is low in this scenario. Second, a short-term consolidation is a likely outcome, with a continued rise before the next volatility window starts in June. Finally, given current dynamics in the markets, a slow rise with a bullish bias is very likely. We don’t expect big bullish momentum to hit the markets, but instead, a steady rise in the technology sector.

tech stocks

In summary, while there may be some short-term volatility in the tech sector, the overall trend for XLK is bullish. Investors who are looking to invest in the tech sector may want to consider adding this ETF to their portfolio, but they should be prepared for potential short-term pullbacks and volatility.

Receive our weekly newsletter.

*We hate spam as you do.

premium service trade alerts   premium service trade alerts   premium service crypto teaser  
WARNING: InvestingHaven.com, our site, is not affiliated and has no connection whatsoever with Invest Haven Group on Invest-Haven.com or Investing-Haven.com. InvestingHaven.com did not have and will never have sales reps. Do not accept financial offers, certainly not by telephone, this is why >>
Taki Tsaklanos

Taki Tsaklanos

Taki has +15 years of experience in global markets. His methodology is unique and effective, yet easy to understand; it is based on chart analysis combined with intermarket / fundamental / sentiment analysis. His work appeared on major financial outlets like FinancialSense, MarketWatch, ... Email: taki.tsaklanos@gmail.com. Twitter: twitter.com/investinghaven

Latest

nasdaq

Enjoy The Party But Watch Out June Won’t Come With A ‘Happy End’

May 28, 2023
breakout icon

The Most Important Chart Of 2023 (updated)

May 28, 2023
market sentiment

Value Stocks Lagging, Growth Stocks Leading? Wrong, 5 Stocks Leading.

May 28, 2023
xrp bull market forecast

XRP: The Most Beautiful Long Term Crypto Chart Of 2023

May 28, 2023

Connect with InvestingHaven

Receive top notch forecasts for free.

*We hate spam as you do.

Categories

  • 2023 Forecasts
  • Stocks
  • Commodities
  • Silver
  • Lithium
  • Crypto

Site Navigation

  • RSS Feed
  • About us
  • Mission 2026
  • Sitemap
  • Privacy & Disclaimer
  • Terms of Service
  • InvestingHaven vs. Invest-Haven
  • Contact Us
Investing
Haven

Top notch forecasting with gold price forecast, many stock predictions, cryptocurrency charts. Many investing tips and crypto market analysis.

Copyright © 2023 InvestingHaven

No Result
View All Result
  • Premium Investing Service
  • Premium Trading Service
  • Premium Crypto Service
  • 2023 Forecasts
  • Stock markets
  • Commodities
  • Lithium
  • Silver
  • Crypto
  • Login & MyAccount

Copyright © 2023 InvestingHaven

Login to your account below

Forgotten Password?

Fill the forms bellow to register

All fields are required. Log In

Retrieve your password

Please enter your username or email address to reset your password.

Log In

    InvestingHaven.com honours your privacy. Read our Privacy Policy