Investing Haven
No Result
View All Result
Gold Silver Investing >>
CRYPTO INVESTING >>
  • 2025 Forecasts
    • 10 market predictions
    • Dow Jones forecast
    • S&P 500 forecast 2025
    • Nasdaq prediction 2025
    • Best altcoins to buy
    • Best crypto to buy now
    • Which crypto will explode
    • 15 crypto forecasts 2025
    • Which precious metal to buy
  • Silver
    • Silver prediction 2025 – 2030
    • Will silver exceed $30?
    • When will silver hit $50?
    • Can silver hit $100?
    • Silver shortage
    • 50-year silver chart
    • Silver bullish reversal
    • Silver seasonality charts
    • How to invest in silver
  • Gold
    • Gold prediction 2025 – 2030
    • Will gold set new ATH?
    • Will gold hit $3,000?
    • Can gold hit $10,000?
    • Gold chart 10 years
    • Gold chart 50 years
    • Gold chart 100 years
    • Gold silver ratio
    • Gold seasonality charts
  • Commodities
    • Coffee forecasts
    • Sugar forecasts
    • Nickel forecasts
    • Lithium investing
  • Crypto forecasts
    • BTC prediction 2025 – 2030
    • ETH prediction 2025 – 2030
    • SOL prediction 2025 – 2030
    • XRP prediction 2025 – 2030
    • XLM prediction 2025 – 2030
    • BNB prediction 2025 – 2030
    • ADA prediction 2025 – 2030
    • AVAX prediction 2025 – 2030
    • KAS prediction 2025 – 2030
    • NEAR prediction 2025 – 2030
    • BCH prediction 2025 – 2030
    • LINK prediction 2025 – 2030
    • DOT prediction 2025 – 2030
    • SUI prediction 2025 – 2030
    • ICP prediction 2025 – 2030
    • LTC prediction 2025 – 2026
    • STX prediction 2025 – 2030
    • DOGE prediction 2025 – 2030
    • SHIB prediction 2025 – 2030
    • PEPE prediction 2025 – 2030
    • FLOKI prediction 2025 – 2030
    • WIF prediction 2025 – 2030
    • ONDO prediction 2025 – 2030
  • News
    • Crypto news
    • Commodities
  • Login
Investing Haven
No Result
View All Result

Home » Reading markets » Dow Theory: Is The US Stock Market Record Bull Run About to End In 2019?

Dow Theory: Is The US Stock Market Record Bull Run About to End In 2019?

Taki T. by Taki T.
July 3, 2024
in Reading markets
dow theory
2.4k
VIEWS
Share on FacebookShare on Twitter

Since the first week of October many investors were caught by surprise with the global market volatility. Although the picture looks better now than 4 weeks ago the market still needs more work in order to confirm it wants to go higher. Is the US stock market record bull run about to end in 2019? Likely not, given data at this point in time, as provided by both the long term Dow Jones chart on 20 years (DJI) as well as the Dow Theory. The latter is the focus of this article.

Note: this article looks at the answer on the question whether the US stock market record bull run is about to end based on chart analysis. We don’t look at fundamentals. We will follow in the next few days with additional evidence on the same question, and it will be posted in our 2019 market forecasts section.

The DOW Theory is one way for analysts and investors to gauge the strength and reliability of a particular market move. The Dow Theory looks into the performance of the Dow Jones Industrial and the Dow Jones Transportation indexes. If both indexes are moving in a similar direction, the current stock market move is likely to continue. If  the two indexes start diverging, a reversal in the current market direction is likely to happen.

Between October and November 2018, we are seeing most investors wondering if the US stock market record bull run will continue or if it came to an end. That’s why this is an appropriate time to revisit a few indicators to see what the DOW theory is pointing towards. This is also a good starting point for now as we will be sharing a more thorough review of key intermarket indicators later on this month.

DOW Theory Indicates Decision Time For The US Stock Market Bull Run

Earlier this year, we were successful in pointing out to our readers how the sell off that happened earlier in 2018 was a healthy correction and that the US stock market strength was heading towards a continuation of the uptrend:

Dow Theory Signals US Stock Market Strength is Here to Stay
Dow Theory Confirms US Stock Markets Still Bullish, Profit Potential Ahead

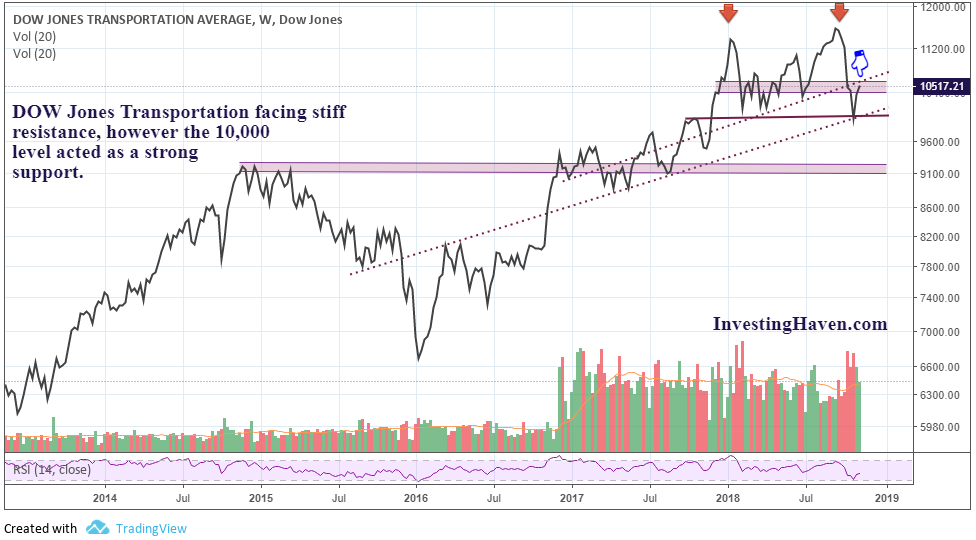
As we look at the up to date weekly chart for the DOW Jones Transportation, we note the following:

  • Since breaking out above 8600 towards the end of 2016, Dow Jones Transportation index is respecting its ascending trend line. The recent bounce showed the strong support at the 10,000 level.
  • The index is also in a stiff resistance zone in the 10,500 as shown below. This could either lead to a consolidation of the gains from the recent years or a retest of the 9000 area.

US stock market record bull run

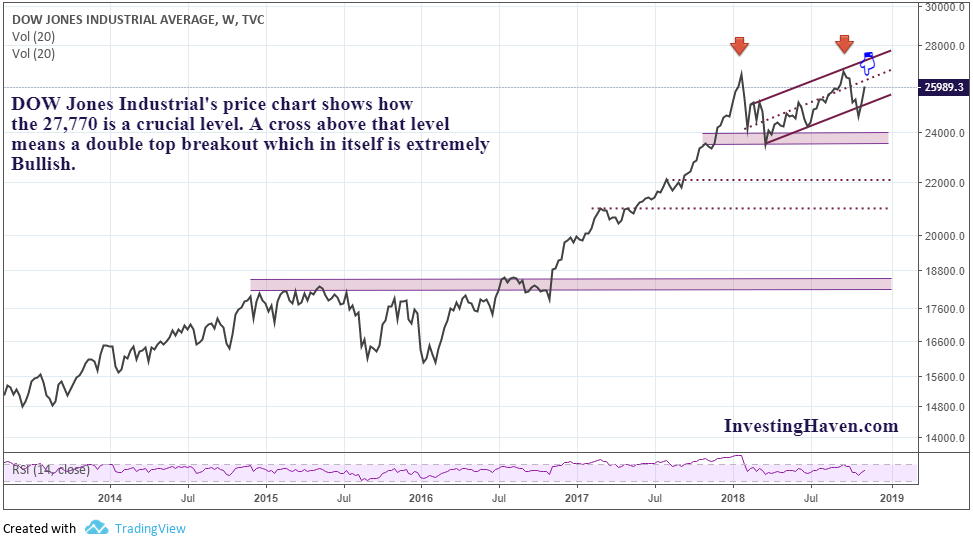
The Dow Jones Industrial Average is showing a similar set up where there is a potential for a double top breakout which could be extremely Bullish. It also shows that we could see the market take a breather and move in a sideways fashion prior to choosing a direction.

US stock market record bull run about the end going into 2019?

All in all, there is no notable divergence for now between both indices. The likelihood for the upcoming months is a sideways movement as per the annotated charts. So far, there is substantial support levels that exclude the potential of a stock market crash and significant overhead resistance that indicates a likely sideways movement. 

Therefore, to answer our initial question: Is The US Stock Market Record Bull Run About to End? No, there is no solid indication of it topping at this point in time. If and when conditions will change we may have to revise our viewpoint as we always need to keep an open mind on changes.

We are looking at a consolidation period which will lead eventually to either a continuation of the Bullish move. Otherwise, lower levels might be revisited. This is inline with the findings published in our recent article stating that the upcoming months will be the most important months for equities in this decade.

Since the conclusion in this article is based on the Dow theory solely, which we tend to consider as a validation method rather than a leading indicator, our  research team will be providing an updated forecast which will include leading indicators. Stay tuned.

dow jones chart

10-YEAR ANNIVERSARY OFFER: InvestingHaven.com celebrates 10 years. Temporarily, you can enjoy a discount on our premium gold/silver and crypto reports. Or you can become a VIP member. Go to our anniversary deals >>
Receive our weekly newsletter.

premium service SP-500 premium service trade alerts premium service crypto teaser 

No related posts.

Tags: DJTDow Jones chartsINDU
Taki T.

Taki T.

Taki is a chart analyst who is passionate about unlocking unique insights out the chart. While the vast majority of analysts remain focused on price analysis, Taki starts with timeline analysis and adds price analysis to this. In doing so, he developed a unique methodology to find opportunities in financial markets, across assets and markets.

Connect with InvestingHaven

Receive top notch forecasts for free.

*We hate spam as you do.

Site Navigation

  • RSS Feed
  • About us
  • Advertising
  • Sponsored Content Policy
  • Mission 2026
  • Sitemap
  • Privacy & Disclaimer
  • Terms of Service
  • Contact Us
investing haven logo

Precious metals market analysis including gold and silver price predictions. Crypto market analysis including highly accurate BTC ETH SOL XRP forecasts.

Copyright © 2025 InvestingHaven

Login to your account below

Forgotten Password?

Fill the forms bellow to register

All fields are required. Log In

Retrieve your password

Please enter your username or email address to reset your password.

Log In

Receive top notch forecasts for free.

*We hate spam as you do.

No Result
View All Result
  • News
  • 2025 Forecasts
    • 10 market predictions
    • Dow Jones forecast 2025
    • S&P 500 forecast 2025
    • Nasdaq prediction 2025
    • Best crypto to buy now
    • Which crypto will explode
    • Best altcoins to buy
    • 15 crypto forecasts 2025
    • Which precious metal to buy
  • Silver articles
    • Silver prediction 2025 – 2030
    • Will silver exceed $30?
    • When will silver hit $50?
    • Can silver hit $100?
    • Silver shortage
    • 50-year silver chart
    • Silver bullish reversal
    • Silver seasonality charts
    • How to invest in silver
  • Gold
    • Gold prediction 2025 – 2030
    • Will gold set new ATH?
    • Will gold hit $3,000?
    • Can gold hit $10,000?
    • Gold chart 10 years
    • Gold chart 50 years
    • Gold chart 100 years
    • Gold silver ratio
    • Gold seasonality charts
  • Commodities
    • Sugar forecasts
    • Coffee forecasts
    • Nickel forecasts
    • Lithium investing
  • Crypto news
  • Crypto forecasts
    • BTC prediction 2025 – 2030
    • ETH prediction 2025 – 2030
    • SOL prediction 2025 – 2030
    • XRP prediction 2025 – 2030
    • XLM prediction 2025 – 2030
    • BNB prediction 2025 – 2030
    • ADA prediction 2025 – 2030
    • AVAX prediction 2025 – 2030
    • KAS prediction 2025 – 2030
    • NEAR prediction 2025 – 2030
    • BCH prediction 2025 – 2030
    • LINK prediction 2025 – 2030
    • DOT prediction 2025 – 2030
    • SUI prediction 2025 – 2030
    • ICP prediction 2025 – 2030
    • LTC prediction 2025 – 2026
    • STX prediction 2025 – 2030
    • DOGE prediction 2025 – 2030
    • SHIB prediction 2025 – 2030
    • PEPE prediction 2025 – 2030
    • FLOKI prediction 2025 – 2030
    • WIF prediction 2025 – 2030
    • ONDO prediction 2025 – 2030
  • Premium Crypto Alerts
  • Premium services

Copyright © 2025 InvestingHaven