Investing Haven
No Result
View All Result
Gold Silver Investing >>
CRYPTO INVESTING >>
  • 2025 Forecasts
    • 10 market predictions
    • Dow Jones forecast
    • S&P 500 forecast 2025
    • Nasdaq prediction 2025
    • Best altcoins to buy
    • Best crypto to buy now
    • Which crypto will explode
    • 15 crypto forecasts 2025
    • Which precious metal to buy
  • Silver
    • Silver prediction 2025 – 2030
    • Will silver exceed $30?
    • When will silver hit $50?
    • Can silver hit $100?
    • Silver shortage
    • 50-year silver chart
    • Silver bullish reversal
    • Silver seasonality charts
    • How to invest in silver
  • Gold
    • Gold prediction 2025 – 2030
    • Will gold set new ATH?
    • Will gold hit $3,000?
    • Can gold hit $10,000?
    • Gold chart 10 years
    • Gold chart 50 years
    • Gold chart 100 years
    • Gold silver ratio
    • Gold seasonality charts
  • Commodities
    • Coffee forecasts
    • Sugar forecasts
    • Nickel forecasts
    • Lithium investing
  • Crypto forecasts
    • BTC prediction 2025 – 2030
    • ETH prediction 2025 – 2030
    • SOL prediction 2025 – 2030
    • XRP prediction 2025 – 2030
    • XLM prediction 2025 – 2030
    • BNB prediction 2025 – 2030
    • ADA prediction 2025 – 2030
    • AVAX prediction 2025 – 2030
    • KAS prediction 2025 – 2030
    • NEAR prediction 2025 – 2030
    • BCH prediction 2025 – 2030
    • LINK prediction 2025 – 2030
    • DOT prediction 2025 – 2030
    • SUI prediction 2025 – 2030
    • ICP prediction 2025 – 2030
    • LTC prediction 2025 – 2026
    • STX prediction 2025 – 2030
    • DOGE prediction 2025 – 2030
    • SHIB prediction 2025 – 2030
    • PEPE prediction 2025 – 2030
    • FLOKI prediction 2025 – 2030
    • WIF prediction 2025 – 2030
    • ONDO prediction 2025 – 2030
  • News
    • Crypto news
    • Commodities
  • Login
Investing Haven
No Result
View All Result

Home » Reading markets » Leading Stock Market Indicator Still Bullish

Leading Stock Market Indicator Still Bullish

Taki T. by Taki T.
November 28, 2023
in Reading markets
leading stock market indicator bullish les indices boursiers avant-coureurs toujours Haussiers
2.1k
VIEWS
Share on FacebookShare on Twitter

U.S. stock markets are hitting new highs this week. The Nasdaq Composite index broke through the psychologically important level of 6,000 points while the small cap index Russell 2000 (RUT) broke above 1400 points. The Dow Jones Industrials (DJI) index briefly touched 21,000 points, and the S&P 500 (SPY) was inches away yesterday from 2,400 points.

It seems that the stock market index is committed to continue its march higher.

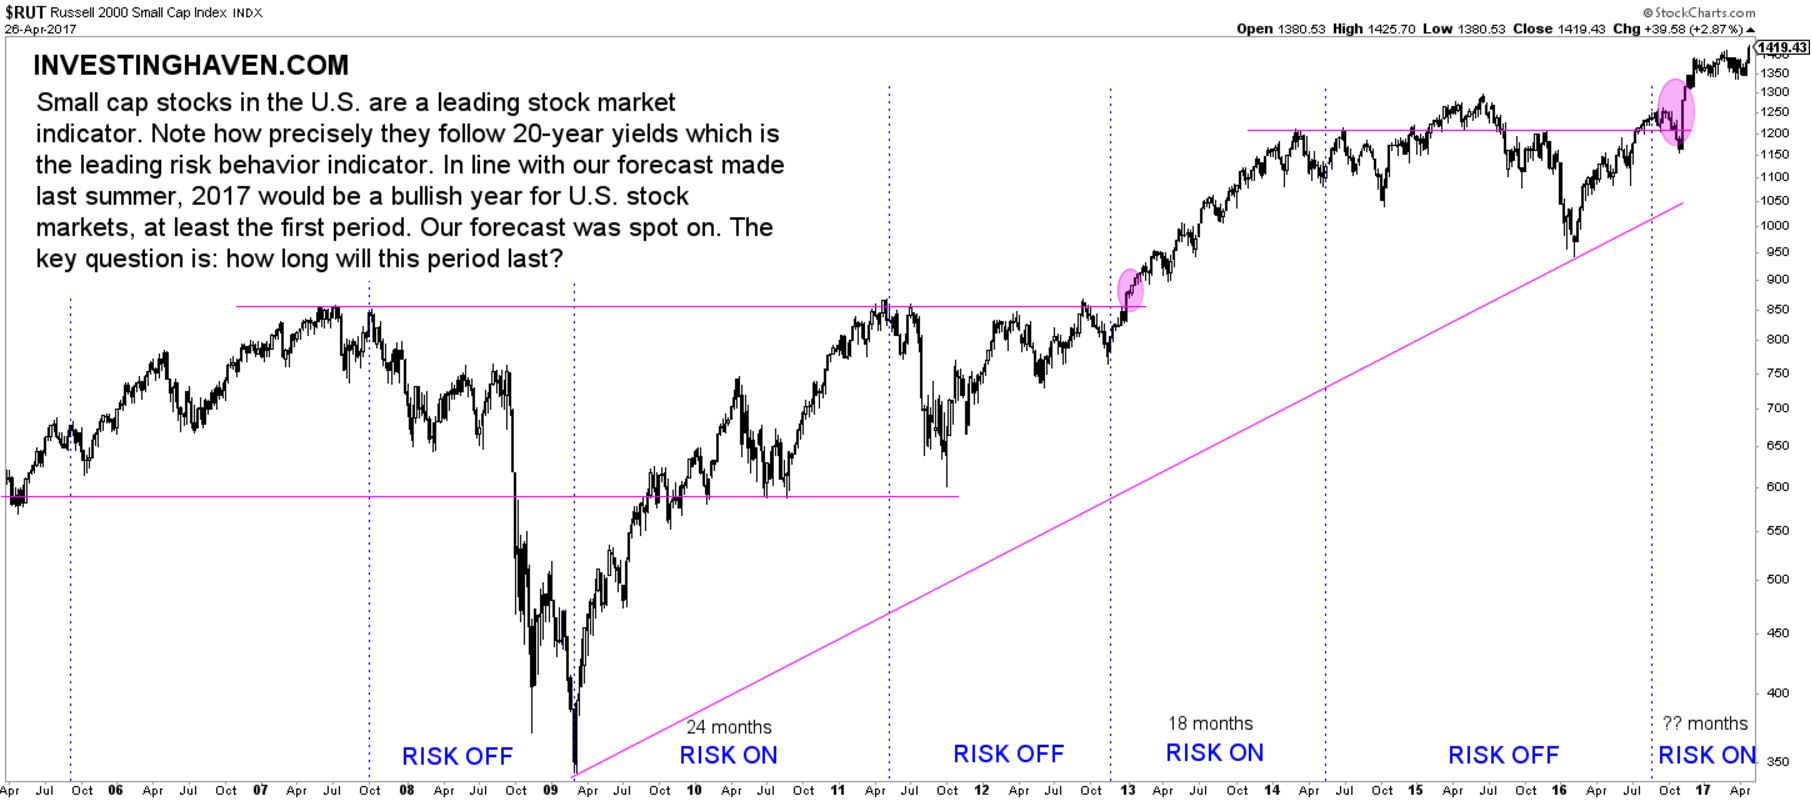
InvestingHaven forecasted last summer that the U.S. stock market would go higher in the first half of 2017, based on this leading stock market indicator for 2017 which is the Russell 2000 in combination with 20-year Yields. That forecast appeared to be spot-on. This recent article followed up, and confirmed the same point: watch Yields as a leading indicator for stock markets in 2017.

The key point is that both stocks and Yields go through a recurring 12 to 24 month cycle in which investors alternate between risk-on (stocks up, Yields up) and risk off (stocks down, Yields down).

With this week’s all-time highs in stocks, the question is for how long this uptrend in stocks will continue. InvestingHaven’s research team forecasts that stocks will still do good until this summer. That is based on the team’s observation of a decreasing time span of the risk-on cycles:

  • Between April 2009 and April 2011, the risk-on cycle lasted 24 months.
  • Between November 2012 and May 2014, the risk-on cycle lasted 18 months.

There is a high probability that the current risk-on cycle will last some 12 months.

InvestingHaven reiterates that stock market will not crash in 2017. However, the start of a severe correction will certainly take place in the coming months, presumably the summer into fall.

Some of the very interesting stock market sectors for the coming weeks (short term trades): 3D printing stocks and clean energy stocks.

leading stock market indicator bullish

10-YEAR ANNIVERSARY OFFER: InvestingHaven.com celebrates 10 years. Temporarily, you can enjoy a discount on our premium gold/silver and crypto reports. Or you can become a VIP member. Go to our anniversary deals >>
Receive our weekly newsletter.

premium service SP-500 premium service trade alerts premium service crypto teaser 

No related posts.

Tags: Dow Jones chartsNASDAQRUSSELL2000SPX
Taki T.

Taki T.

Taki is a chart analyst who is passionate about unlocking unique insights out the chart. While the vast majority of analysts remain focused on price analysis, Taki starts with timeline analysis and adds price analysis to this. In doing so, he developed a unique methodology to find opportunities in financial markets, across assets and markets.

Leave a Reply Cancel reply

Your email address will not be published. Required fields are marked *

Connect with InvestingHaven

Receive top notch forecasts for free.

*We hate spam as you do.

Site Navigation

  • RSS Feed
  • About us
  • Advertising
  • Sponsored Content Policy
  • Mission 2026
  • Sitemap
  • Privacy & Disclaimer
  • Terms of Service
  • Contact Us
investing haven logo

Precious metals market analysis including gold and silver price predictions. Crypto market analysis including highly accurate BTC ETH SOL XRP forecasts.

Copyright © 2025 InvestingHaven

Login to your account below

Forgotten Password?

Fill the forms bellow to register

All fields are required. Log In

Retrieve your password

Please enter your username or email address to reset your password.

Log In

Receive top notch forecasts for free.

*We hate spam as you do.

No Result
View All Result
  • News
  • 2025 Forecasts
    • 10 market predictions
    • Dow Jones forecast 2025
    • S&P 500 forecast 2025
    • Nasdaq prediction 2025
    • Best crypto to buy now
    • Which crypto will explode
    • Best altcoins to buy
    • 15 crypto forecasts 2025
    • Which precious metal to buy
  • Silver articles
    • Silver prediction 2025 – 2030
    • Will silver exceed $30?
    • When will silver hit $50?
    • Can silver hit $100?
    • Silver shortage
    • 50-year silver chart
    • Silver bullish reversal
    • Silver seasonality charts
    • How to invest in silver
  • Gold
    • Gold prediction 2025 – 2030
    • Will gold set new ATH?
    • Will gold hit $3,000?
    • Can gold hit $10,000?
    • Gold chart 10 years
    • Gold chart 50 years
    • Gold chart 100 years
    • Gold silver ratio
    • Gold seasonality charts
  • Commodities
    • Sugar forecasts
    • Coffee forecasts
    • Nickel forecasts
    • Lithium investing
  • Crypto news
  • Crypto forecasts
    • BTC prediction 2025 – 2030
    • ETH prediction 2025 – 2030
    • SOL prediction 2025 – 2030
    • XRP prediction 2025 – 2030
    • XLM prediction 2025 – 2030
    • BNB prediction 2025 – 2030
    • ADA prediction 2025 – 2030
    • AVAX prediction 2025 – 2030
    • KAS prediction 2025 – 2030
    • NEAR prediction 2025 – 2030
    • BCH prediction 2025 – 2030
    • LINK prediction 2025 – 2030
    • DOT prediction 2025 – 2030
    • SUI prediction 2025 – 2030
    • ICP prediction 2025 – 2030
    • LTC prediction 2025 – 2026
    • STX prediction 2025 – 2030
    • DOGE prediction 2025 – 2030
    • SHIB prediction 2025 – 2030
    • PEPE prediction 2025 – 2030
    • FLOKI prediction 2025 – 2030
    • WIF prediction 2025 – 2030
    • ONDO prediction 2025 – 2030
  • Premium Crypto Alerts
  • Premium services

Copyright © 2025 InvestingHaven