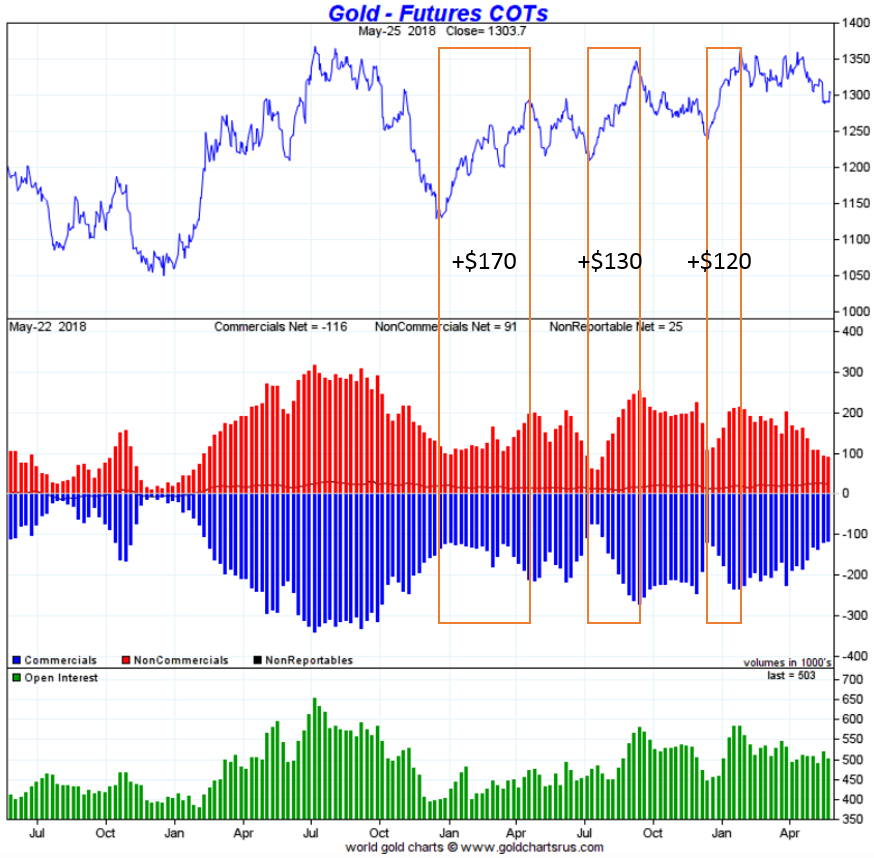
The gold chart of the Commitment of Traders report, in short COT report, may be hinting at a mega breakout in the gold price anytime soon. That would be in line with our bullish gold price forecast as well as our top 3 long term gold charts.
Essentially the gold COT chart shows the positions of several market participants, but the commercial traders and their short positions are the ones that are of most interest to us. They are indicated with the red bars on the chart.
Every time in the last 18 months that those positions have dropped below current readings it resulted in a strong uptake in their short positions which lead to explosive price moves. We have indicated the 3 most important instances with the orange boxes.
Each time price moved significantly higher.
Why is this so important? Because, if this event were to happen again, which is very likely by the way, the price of gold would go to $1400 or higher. From a chart perspective, it would be a breakout, and our recent call would be materialized: Gold Price Explosive Upside Potential Once It Moves Back Above 1300.
We believe it is a matter of time until commercial traders increase their short positions. We believe it is a matter of time until gold breaks out. The market is keeping things in suspense, and that is great as many who took positions in recent months will get disappointed and sell their positions. When there is enough critical mass in this trend it will finally result in that breakout that everyone is anticipating for such a long time.
Chart courtesy: Goldchartsrus.com


