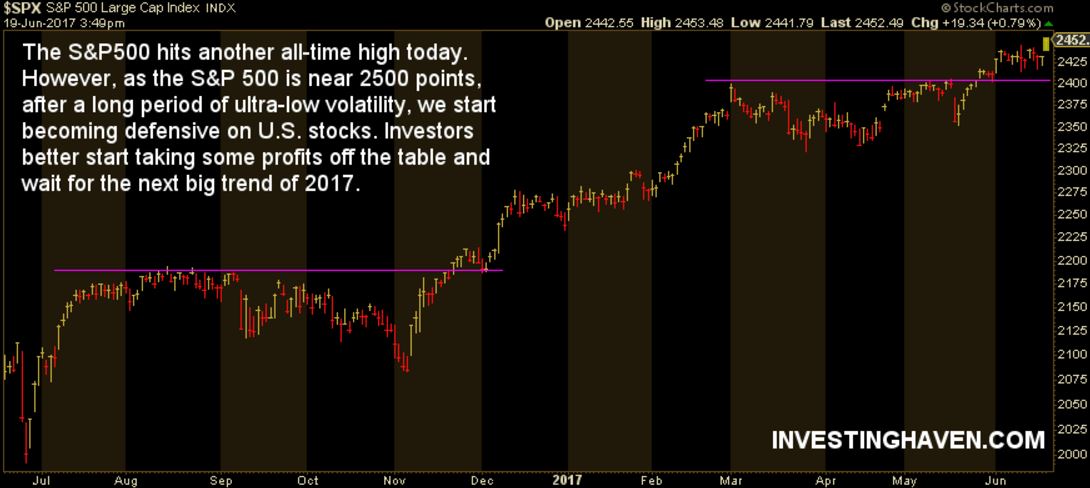
U.S. stocks are moving higher again. The leading stock market index in the U.S., the S&P 500 (SPY), is about to close at 2452 points today. That is another all-time high. This is extremely strong, that is a fact.
But for how long can this trend continue? Markets simply do not go in one straight line up.
We have forecasted a bullish stock market outlook for 2017 already in the fall of last year. That based on our intermarket methodology in which 10-year Yields are a leading indicator for stocks.
We followed up on that recently suggesting to watch 10-year Yields to understand the next trend in markets. According to that we would expect serious volatility as of the summer of 2017 … and the summer officially starts tomorrow.
Given the renewed bullish energy in stocks, we can imagine this bullish trend to continue for another couple of weeks. The sell in May effect may not have been very accurate, but we are becoming really fearful of a strong August to October correction. And by strong, we really mean strong. That was also triggered by technology stocks forecasting a stock market peak.
In the meantime, investors can start taking some profits off the table, and select their favorite bullish assets among our suggested markets that will outperform in the coming months as explained in Waiting For The Next Profitable Trend In Markets In 2017.
Smart investors ride a large part of a trend but do not aim to sell at the absolute top. Rather, they are good taking profits below the top, when the risk is contained, and prepare meantime their next trade based on new bull markets.


