As explained in great detail, already many months ago, in our gold forecast 2019 as well as our silver forecast 2019 we said 2019 would be a mildly bullish period for the precious metals space. Today we see another confirmation of this forecast materializing, exactly at a time when broad stock markets break down. This is also confirmed by the trends on our top 3 long term gold charts. The place to be is now top gold stocks as well as silver stocks.
Some 2 months ago we also wrote about sector rotation taking place in markets. That was mid-October, right at the start of the ongoing correction in broad markets and near the bottom of precious metals stocks.
Today, one day after the Fed’s decision to increase Fed’s fund rate which caused turmoil in markets and a sell-off in precious metals we see a continuation of the picture we mentioned above. In other words a deterioration of broad stock markets and a continued improvement in gold stocks as well as silver stocks.
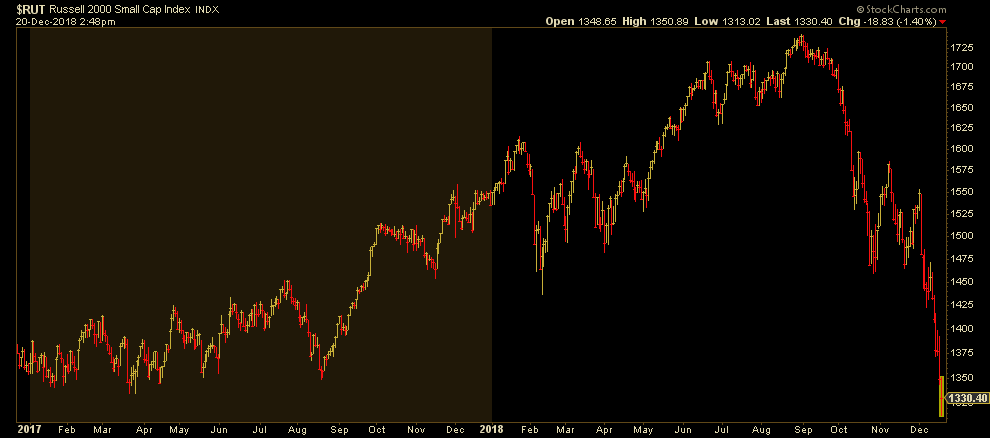
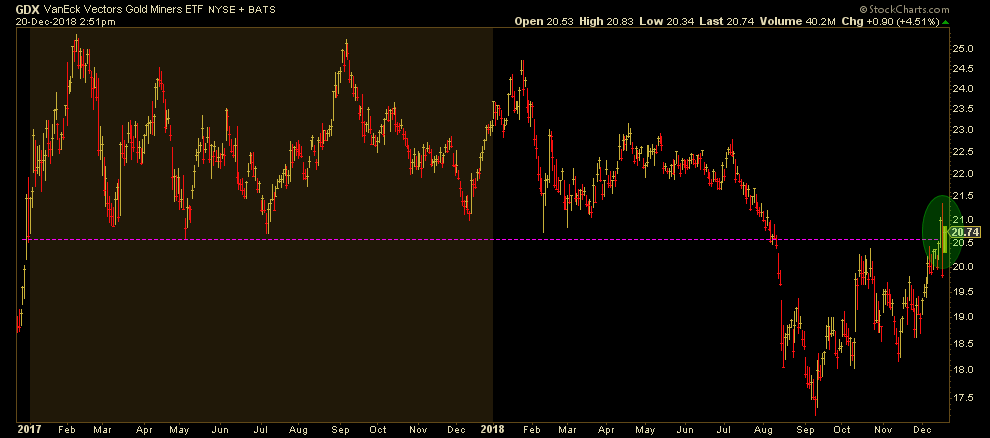
We can write books about market sector rotation, but, as always, one visual can tell much more than 1000 words. That’s why we have included what we consider this must-see chart below. It shows at the top the Russell 2000 index, our leading indicator for small cap stocks, followed by precious metals stocks, represented by the GDX ETF (GDX).
The one chart is a mirror of the other chart.
That’s what sector rotation is about: capital flowing from one asset / market / sector to another one. It indicates that smart investors started already in October pulling their capital from the weakening broad stock market sector into the strengthening gold and silver sector.
Note that we have favored First Majestic Silver on multiple occasions (here, here and here).


