Investing Haven
No Result
View All Result
Gold Silver Investing >>
CRYPTO INVESTING >>
  • 2025 Forecasts
    • 10 market predictions
    • Dow Jones forecast
    • S&P 500 forecast 2025
    • Nasdaq prediction 2025
    • Best altcoins to buy
    • Best crypto to buy now
    • Which crypto will explode
    • 15 crypto forecasts 2025
    • Which precious metal to buy
  • Silver
    • Silver prediction 2025 – 2030
    • Will silver exceed $30?
    • When will silver hit $50?
    • Can silver hit $100?
    • Silver shortage
    • 50-year silver chart
    • Silver bullish reversal
    • Silver seasonality charts
    • How to invest in silver
  • Gold
    • Gold prediction 2025 – 2030
    • Will gold set new ATH?
    • Will gold hit $3,000?
    • Can gold hit $10,000?
    • Gold chart 10 years
    • Gold chart 50 years
    • Gold chart 100 years
    • Gold silver ratio
    • Gold seasonality charts
  • Commodities
    • Coffee forecasts
    • Sugar forecasts
    • Nickel forecasts
    • Lithium investing
  • Crypto forecasts
    • BTC prediction 2025 – 2030
    • ETH prediction 2025 – 2030
    • SOL prediction 2025 – 2030
    • XRP prediction 2025 – 2030
    • XLM prediction 2025 – 2030
    • BNB prediction 2025 – 2030
    • ADA prediction 2025 – 2030
    • AVAX prediction 2025 – 2030
    • KAS prediction 2025 – 2030
    • NEAR prediction 2025 – 2030
    • BCH prediction 2025 – 2030
    • LINK prediction 2025 – 2030
    • DOT prediction 2025 – 2030
    • SUI prediction 2025 – 2030
    • ICP prediction 2025 – 2030
    • LTC prediction 2025 – 2026
    • STX prediction 2025 – 2030
    • DOGE prediction 2025 – 2030
    • SHIB prediction 2025 – 2030
    • PEPE prediction 2025 – 2030
    • FLOKI prediction 2025 – 2030
    • WIF prediction 2025 – 2030
    • ONDO prediction 2025 – 2030
  • News
    • Crypto news
    • Commodities
  • Login
Investing Haven
No Result
View All Result

Home » Breakout / Breakdown » 5 Must-See Charts As Gold Is Turning Bullish In 2018

5 Must-See Charts As Gold Is Turning Bullish In 2018

Taki T. by Taki T.
November 28, 2023
in Breakout / Breakdown
gold price bullish
2.1k
VIEWS
Share on FacebookShare on Twitter

Our gold price forecast for 2018 will potentially be invalidated. We this on the short but also long term gold charts 

Let’s revisit our thesis, and the reasons why we believe gold will bullish in 2018, not bearish.

Changing intermarket dynamics in 2018

Very important to note: as our research team has shown in this Safe Haven Forecast 2018: Correlation Between Gold And The Japanese Yen something very odd is happening right now: the traditional correlation between the Yen and gold is breaking up, after it has held many years. Either the Yen or gold is ‘cheating’, the challenge of our analyst team is to understand what exactly is going on. We believe that all charts in this article suggest a bullish outcome for gold.

Gold price chart

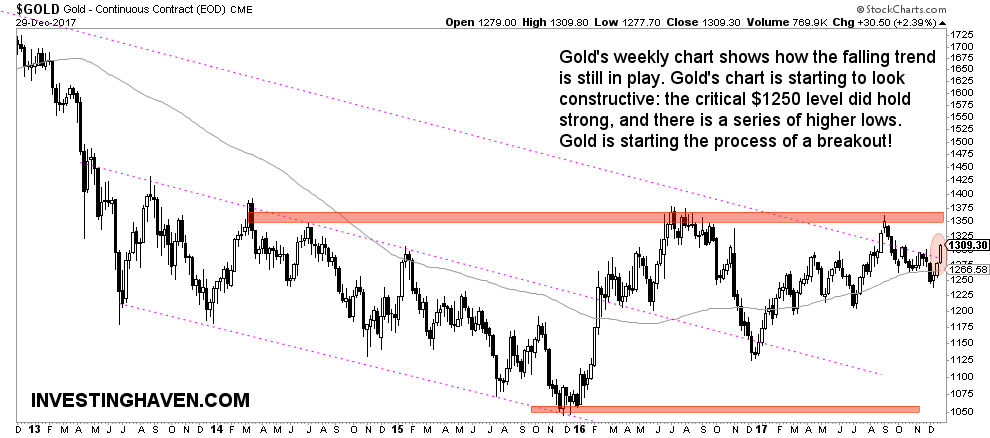
First of all, the most critical price point on the gold chart is $1250. As gold was moving below $1250 in December we were convinced it was signaling weakness, and the continuation of the downtrend or, at best, a sideways pattern.

However, gold stopped falling at $1230. That was a first red flag going against our forecast.

With that, gold’s price chart starts looking constructive. Note how it is today breaking out of its falling 7-year bear market trend. Note also this series of higher lows. This is not yet the real deal though, as said in our 2018 forecast a real bull market starts once gold crosess the $1350 to $1370 area. This is what we wrote:

The possibility of gold to break out into a new secular uptrend in 2018 seems to be unlikely, at least according to us. The only thing we say about this: once the price of gold goes above $1375, and trades there for at least 3 consecutive weeks, we could be looking at a breakout scenario. In that case $1550 would be a price target.

As gold is now moving to test the $1350 area it is key to watch if and how long it will be able to trade above $1350.

Not only is the chart setup looking stronger it is also the commodity trade that underpins a bullish outcome for gold. We wrote a bullish copper price forecast for 2018, bullish uranium forecast for 2018, and several other commodities are moving stronger than we expected.

As an analyst it is perfectly fine, and even a best practice, to constantly revisit your thesis, and adjust where and when needed. That is why we increase the odds of a bullish outcome in the gold market in 2018.

gold price 2018

Gold futures chart

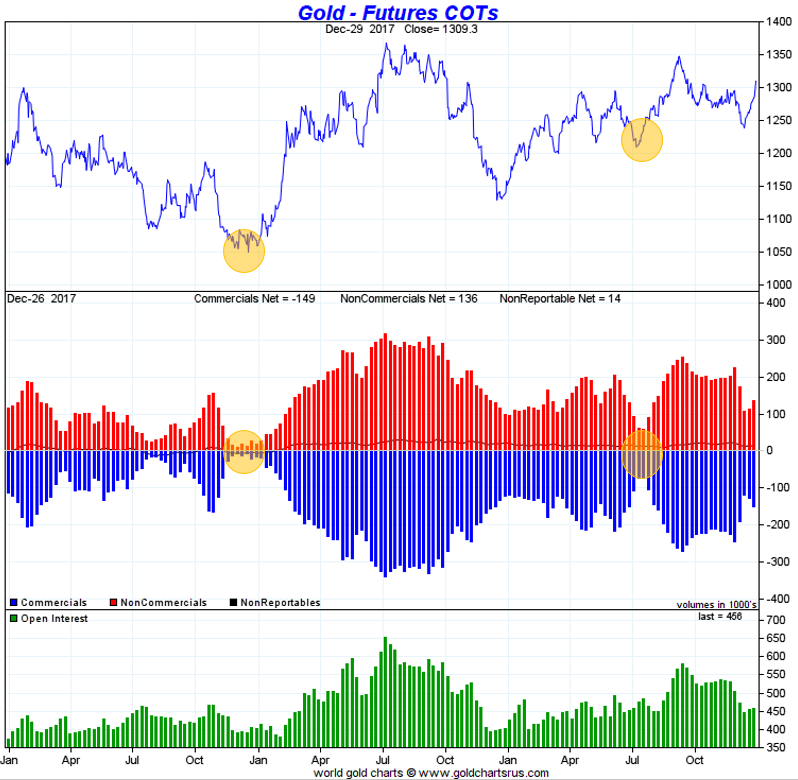
The second must-see gold chart is the COT futures positions. It is not a timing indicator nor a price forecast tool. The COT gives you a good view on the ongoing bigger picture trend. Note this ‘rule’ only applies to precious metals.

As shown by the yellow circles there is a series of higher lows in the gold price which is associated with similar net short positions of commercials. This suggests that commercials are not able to push the gold price lower, even if they try hard.

Moreover, and this is surprising to us, recent attempts to push the price lower failed. We were expecting to see a mini-crash in December, with ultra low short positions by commercials. The opposite is happening. This is a bullish sign, without any doubt, and another reason we have to revisit our initial 2018 forecast.

gold futures 2018

Gold miners chart

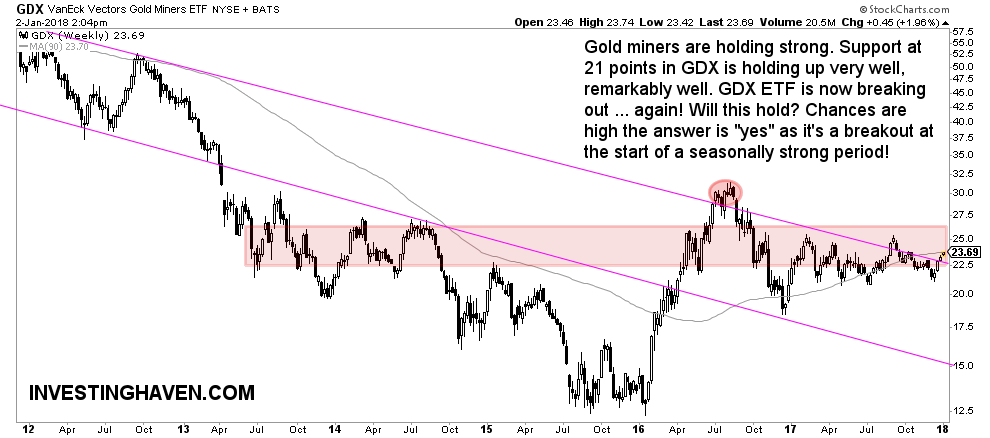
The gold mining chart GDX (GDX) shows strength by refusing to go lower. Support seems very strong in the 21 point area. Even in December, traditionally a weak month, we have not seen any significant weakness.

gold miners 2018

Silver miners chart

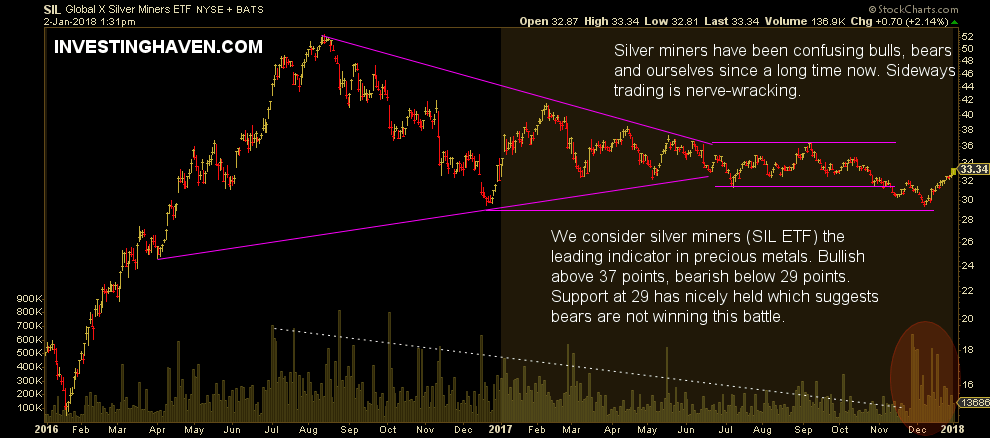
Probably the most important precious metals chart to us is the silver mining chart, SIL ETF, shown below. We consider this the leading indicator for the precious metals market.

The area at 29 points was a very important support level one year ago in December. It held strong last month, and this is the single most important chart in the precious metals space right now. Moreover, apart from this critical support level, we also see trading volume picking up, after an 18 month decline.

This silver mining chart is for us the ultimate confirmation of strength in the gold and silver market!

silver miners 2018

U.S. dollar index

Last but not least, the U.S. dollar index really looks weak. We had expected a continuation of the recent rally. However, as the impact of Yields on the U.S. dollar is fading we believe there is a new intermarket dynamic trend. We cannot ignore this, and, again, it makes us aware that we have to revisit our initial gold price forecast.

10-YEAR ANNIVERSARY OFFER: InvestingHaven.com celebrates 10 years. Temporarily, you can enjoy a discount on our premium gold/silver and crypto reports. Or you can become a VIP member. Go to our anniversary deals >>
Receive our weekly newsletter.

premium service SP-500 premium service trade alerts premium service crypto teaser 

No related posts.

Tags: GOLD
Taki T.

Taki T.

Taki is a chart analyst who is passionate about unlocking unique insights out the chart. While the vast majority of analysts remain focused on price analysis, Taki starts with timeline analysis and adds price analysis to this. In doing so, he developed a unique methodology to find opportunities in financial markets, across assets and markets.

Leave a Reply Cancel reply

Your email address will not be published. Required fields are marked *

Connect with InvestingHaven

Receive top notch forecasts for free.

*We hate spam as you do.

Site Navigation

  • RSS Feed
  • About us
  • Advertising
  • Sponsored Content Policy
  • Mission 2026
  • Sitemap
  • Privacy & Disclaimer
  • Terms of Service
  • Contact Us
investing haven logo

Precious metals market analysis including gold and silver price predictions. Crypto market analysis including highly accurate BTC ETH SOL XRP forecasts.

Copyright © 2025 InvestingHaven

Login to your account below

Forgotten Password?

Fill the forms bellow to register

All fields are required. Log In

Retrieve your password

Please enter your username or email address to reset your password.

Log In

Receive top notch forecasts for free.

*We hate spam as you do.

No Result
View All Result
  • News
  • 2025 Forecasts
    • 10 market predictions
    • Dow Jones forecast 2025
    • S&P 500 forecast 2025
    • Nasdaq prediction 2025
    • Best crypto to buy now
    • Which crypto will explode
    • Best altcoins to buy
    • 15 crypto forecasts 2025
    • Which precious metal to buy
  • Silver articles
    • Silver prediction 2025 – 2030
    • Will silver exceed $30?
    • When will silver hit $50?
    • Can silver hit $100?
    • Silver shortage
    • 50-year silver chart
    • Silver bullish reversal
    • Silver seasonality charts
    • How to invest in silver
  • Gold
    • Gold prediction 2025 – 2030
    • Will gold set new ATH?
    • Will gold hit $3,000?
    • Can gold hit $10,000?
    • Gold chart 10 years
    • Gold chart 50 years
    • Gold chart 100 years
    • Gold silver ratio
    • Gold seasonality charts
  • Commodities
    • Sugar forecasts
    • Coffee forecasts
    • Nickel forecasts
    • Lithium investing
  • Crypto news
  • Crypto forecasts
    • BTC prediction 2025 – 2030
    • ETH prediction 2025 – 2030
    • SOL prediction 2025 – 2030
    • XRP prediction 2025 – 2030
    • XLM prediction 2025 – 2030
    • BNB prediction 2025 – 2030
    • ADA prediction 2025 – 2030
    • AVAX prediction 2025 – 2030
    • KAS prediction 2025 – 2030
    • NEAR prediction 2025 – 2030
    • BCH prediction 2025 – 2030
    • LINK prediction 2025 – 2030
    • DOT prediction 2025 – 2030
    • SUI prediction 2025 – 2030
    • ICP prediction 2025 – 2030
    • LTC prediction 2025 – 2026
    • STX prediction 2025 – 2030
    • DOGE prediction 2025 – 2030
    • SHIB prediction 2025 – 2030
    • PEPE prediction 2025 – 2030
    • FLOKI prediction 2025 – 2030
    • WIF prediction 2025 – 2030
    • ONDO prediction 2025 – 2030
  • Premium Crypto Alerts
  • Premium services

Copyright © 2025 InvestingHaven